| |
One needs to use the more intense characteristic energy
lines to obtain more accurate composition. For instance, for the Mo case shown in Figure 1383a, the intense, primary
L lines are normally selected in Mo EDS measurements.
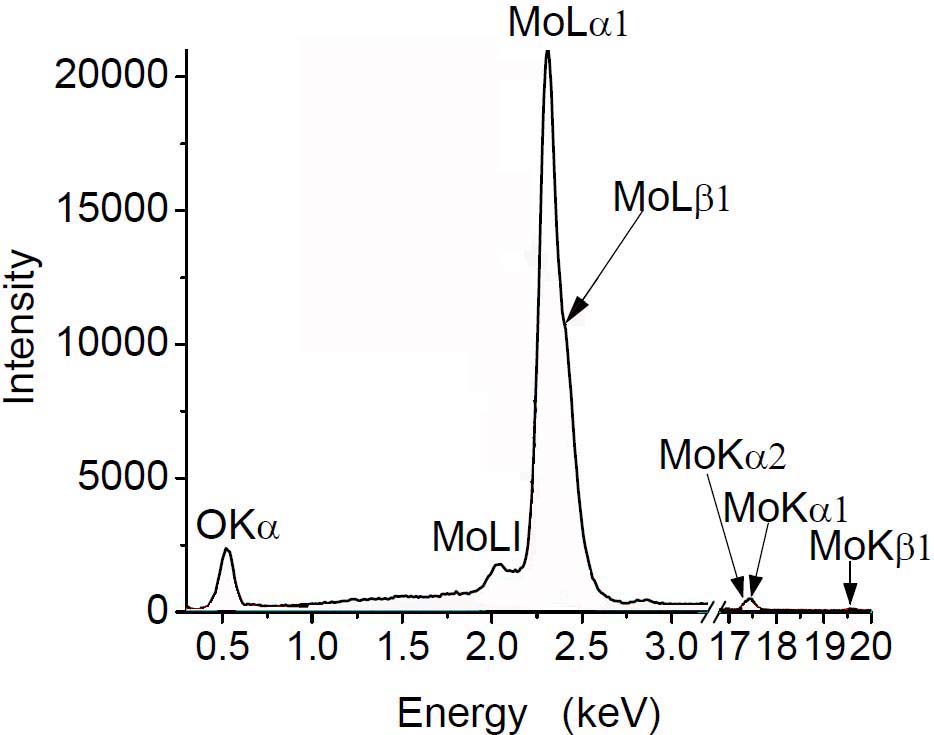
| Figure 1383a. EDX spectrum showing the O and Mo experimental peaks obtained from MoO3 materials. |
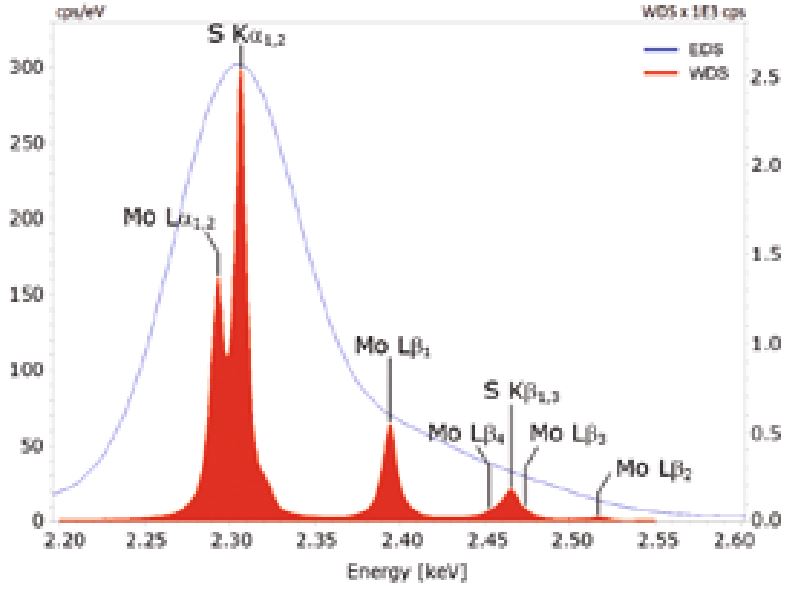
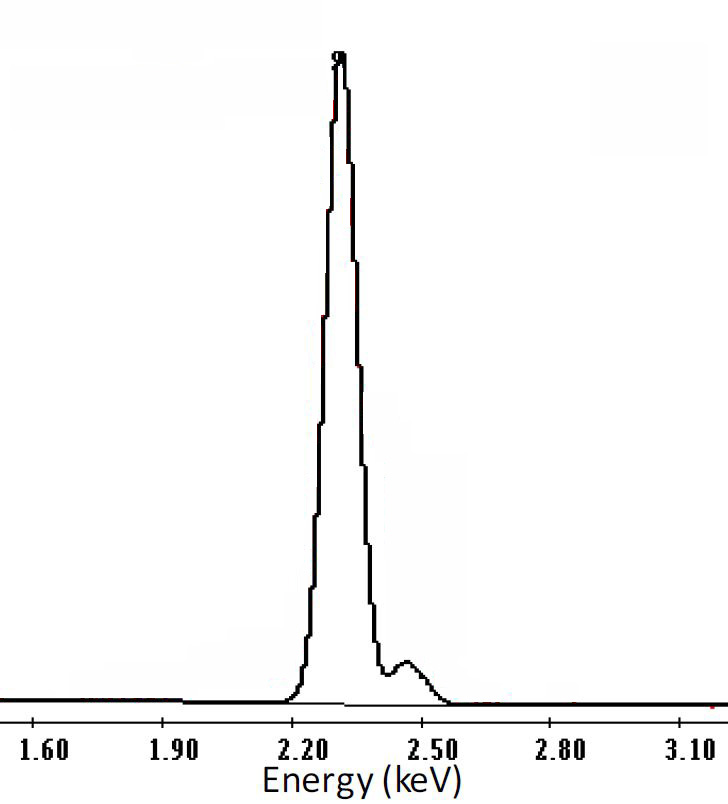
For MoS2, the overlap between the L series peaks of Mo and the S Kα peak is very pronounced: only a broadened peak
with a tail towards the high energy end can be seen with
EDS. Figure 1383b shows the sulfur and molybdenum peaks overlap in the EDS spectrum, but are separated and sharp in the WDS spectrum.
Figure 1383b. Comparison of the EDS and WDS spectra taken from Molybdenite (MoS2): (a) and (b) are obtained from different measurements. [1] |
In a TEM (usually operated at voltages of 200 ~ 400 keV), the K lines (~17.45 keV) of Mo will be excited and visible, while in an SEM, it will be very different if operated at 20 keV or below (see overvoltage).
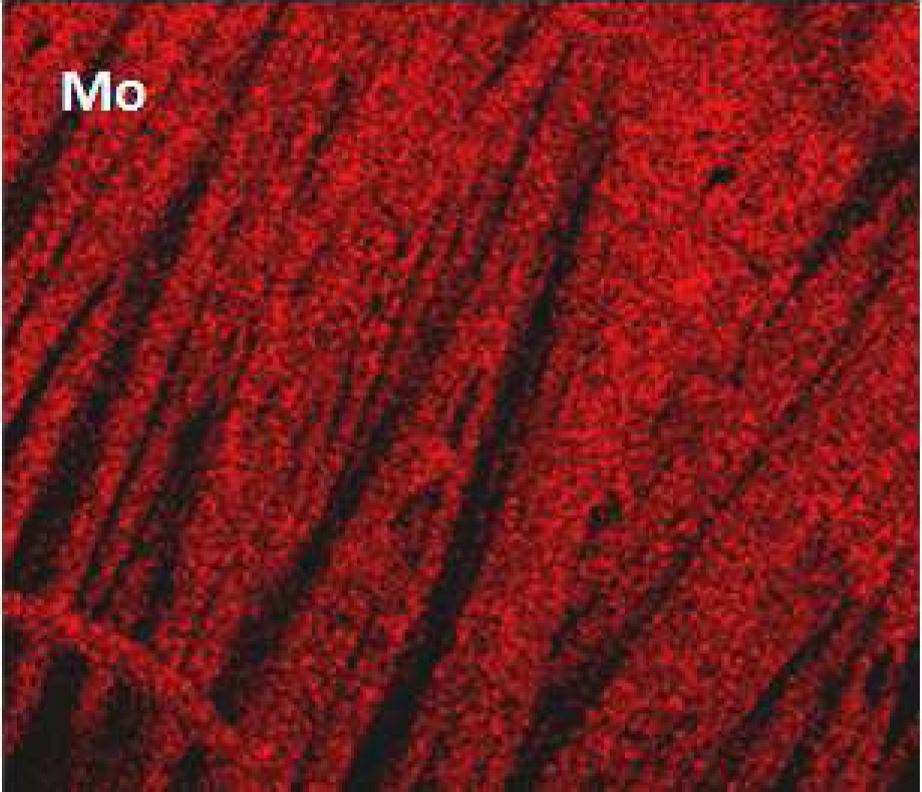
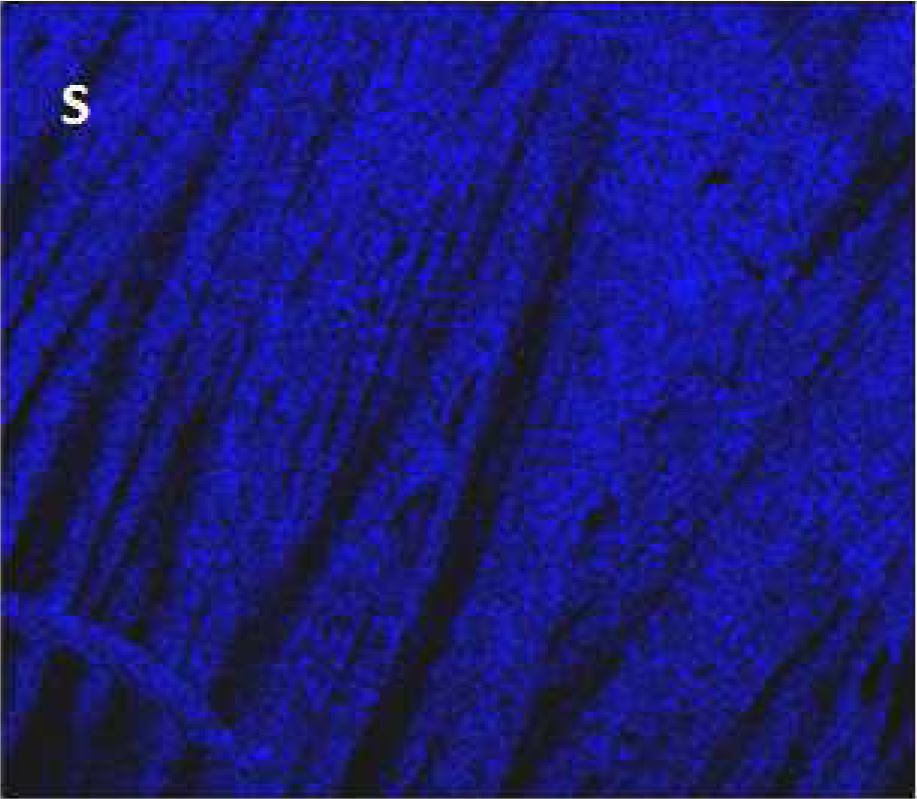
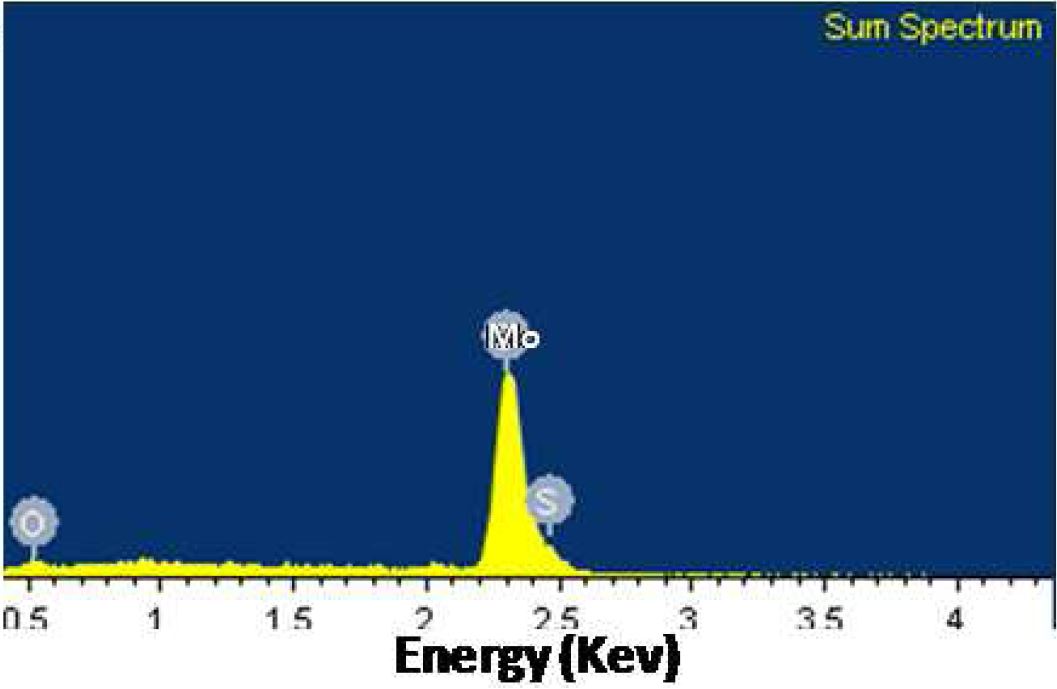
INCA EDS software is used to extract the maps in Figure 1383c.
Figure 1383c. EDS measurements of MoS2 nanosheets: Elemental mapping images of Mo (a) and S (b), and (c) Spectroscopy indicating the presence of Mo, S, and O. Adapted from [2] |
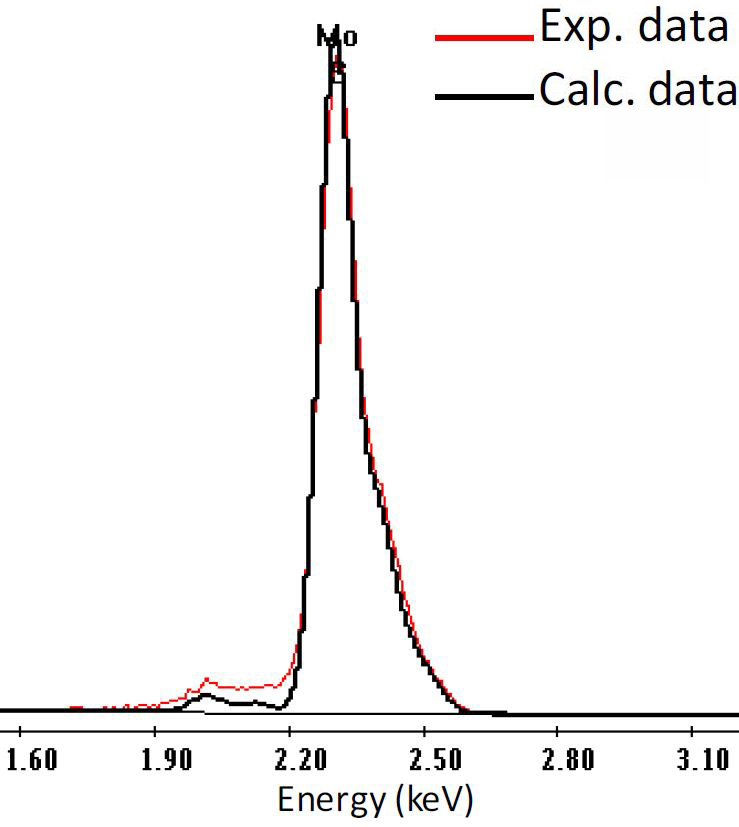
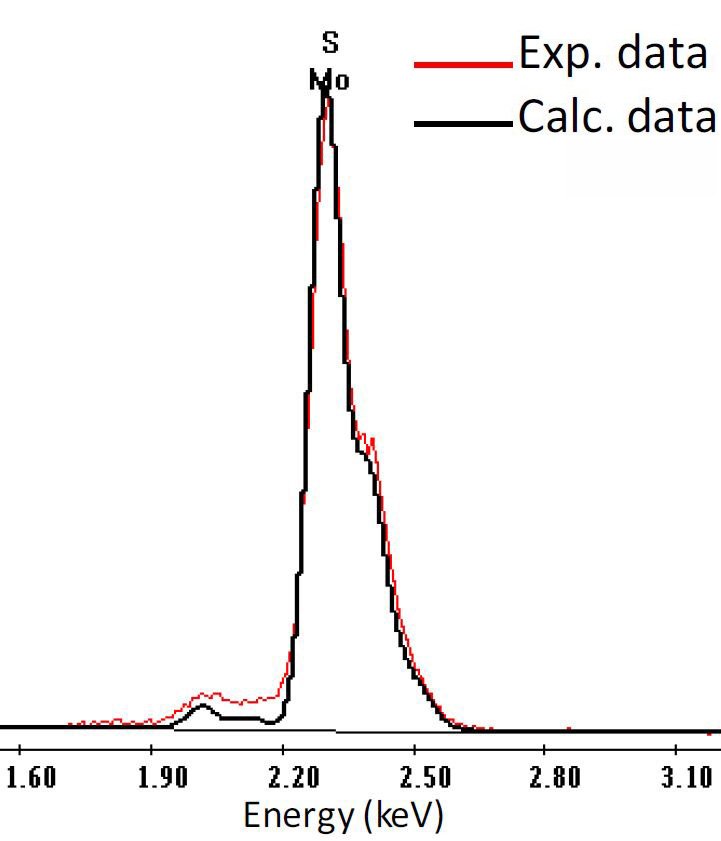
Table 1383 shows the calculated (in black) and experimental (in red) peaks of samples with pure sulfur, pure molybdenum, 1 wt% S + 99 wt% Mo, and 15 wt% S + 85 wt% Mo. The main consideration about the match between calculated and experimental curves are the portion of 1.2 times of the full width at half maximum (FWHM) of the peaks. For the sample with 1 wt% S + 99 wt% Mo, the maximum of the calculated peak does not match the maximum of the experimental one since the calculated curve slightly shifts to the left of the experimental curve, while the two peaks of the calculated and experimental curves match each other better when 1 wt% S is considered. For the sample with 15 wt% S + 85 wt% Mo, the shapes of the calculated and experimental curves math each other when 15 wt% S is considered.
| Table 1383 shows the calculated (in black) and experimental (in red) peaks of samples with pure sulfur, pure molybdenum, 1 wt% S + 99 wt% Mo, and 15 wt% S + 85 wt% Mo. The figures of EDS curves are adapted from [3]. |
| |
S only |
15 % S + 85 % Mo |
1 % S + 99 % Mo |
Mo only |
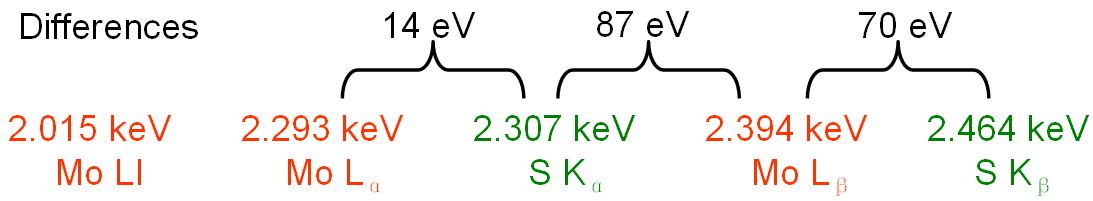
| X-ray lines |
|
| Energy resolution of EDS detector |
~130 eV (larger than the differences above so that the detector cannot resolve the differences) |
| Correct calculation of curves |
|
|
|
|
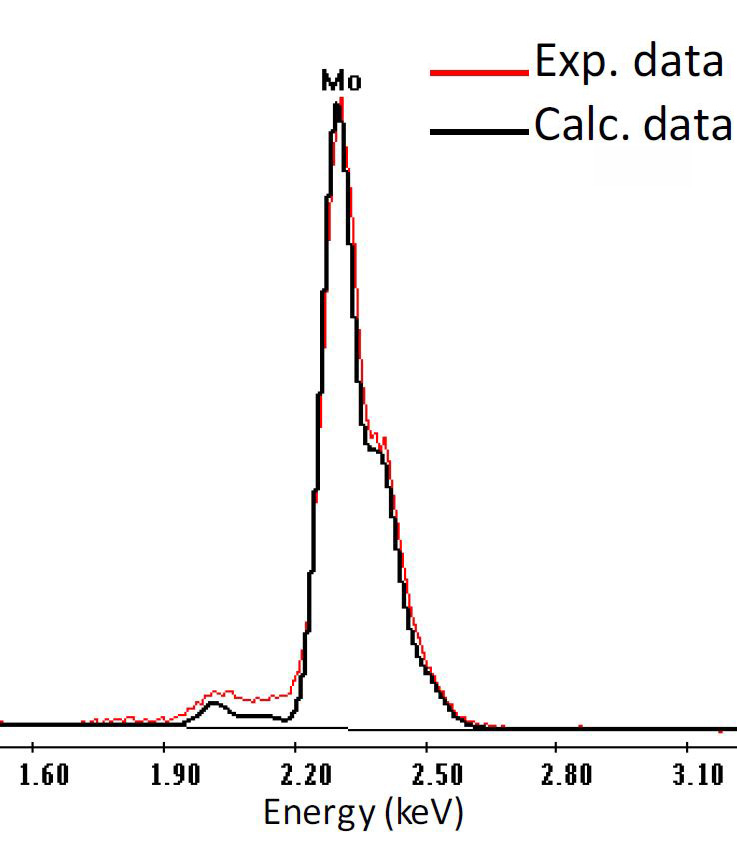
| Both of black and red curves are EDS of 15 % S + 85 % Mo. The peaks of the calculated and experimental curves match each other when 15 wt% S is considered |
Both of black and red curves are EDS of 1 % S + 99 % Mo. The peaks of the calculated and experimental curves match each other when 1 wt% S is considered |
| Wrong calculation of curves |
|
|
|
|
| |
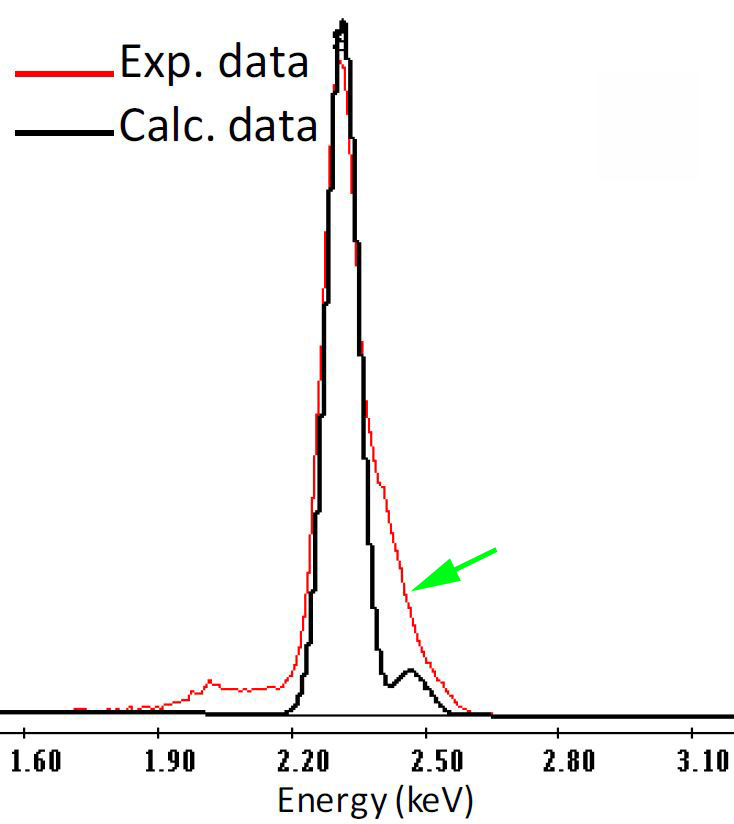
Black curve is EDS of pure S, and red curve is EDS of 15 % S + 85 % Mo. The calculated and experimental curves do not match each other (see the green arrow) when no Mo is considered |
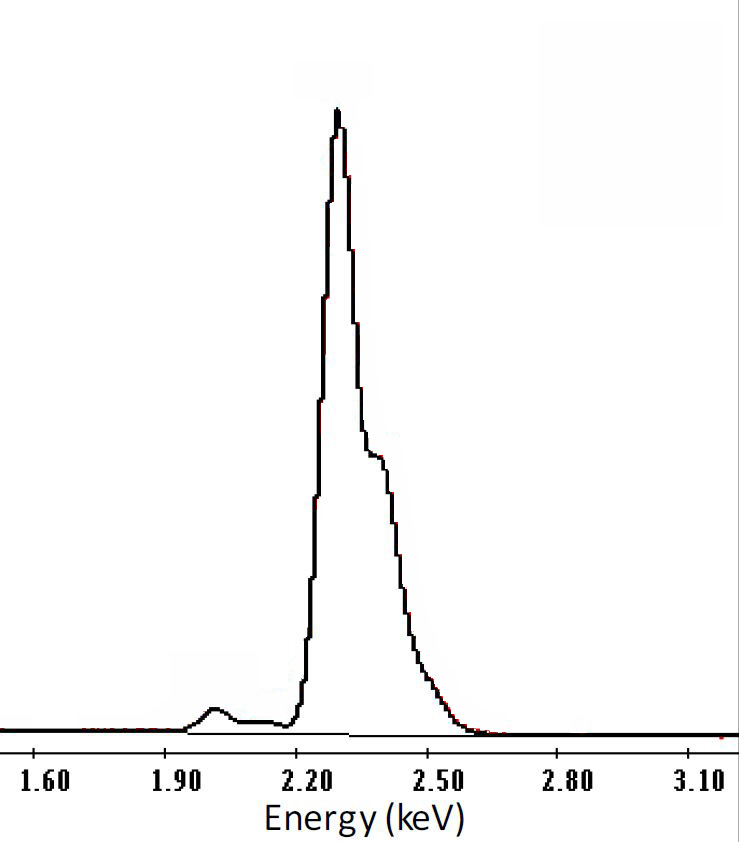
Black curve is EDS of pure Mo, and red curve is EDS of 1 % S + 99 % Mo. The peaks of the calculated and experimental curves do not match each other when no Mo is considered |
|
[1] www.bruker.com.
[2] Revannath Dnyandeo Nikam, Ang-Yu Lu, Poonam Ashok Sonawane, U. Rajesh Kumar, Kanchan Yadav, Lain-Jong Li, and Yit-Tsong Chen, Three-Dimensional Heterostructures of MoS2 Nanosheets on
Conducting MoO2 as an Efficient Electrocatalyst To Enhance Hydrogen Evolution Reaction, ACS Appl. Mater. Interfaces 2015, 7, 23328−23335.
[3] Carlos Angeles-Chavez, Jose Antonio Toledo-Antonio and Maria Antonia Cortes-Jacome, Chemical Quantification Mo-S W-Si Ti-V by Energy Dispersive X-Ray Spectroscopy, in X-Ray Spectroscopy, edited by Shatendra K Sharma, 2012.
|
|