EDS Measurement of Platinum (Pt) - Practical Electron Microscopy and Database - - An Online Book - |
||||||
| Microanalysis | EM Book https://www.globalsino.com/EM/ | ||||||
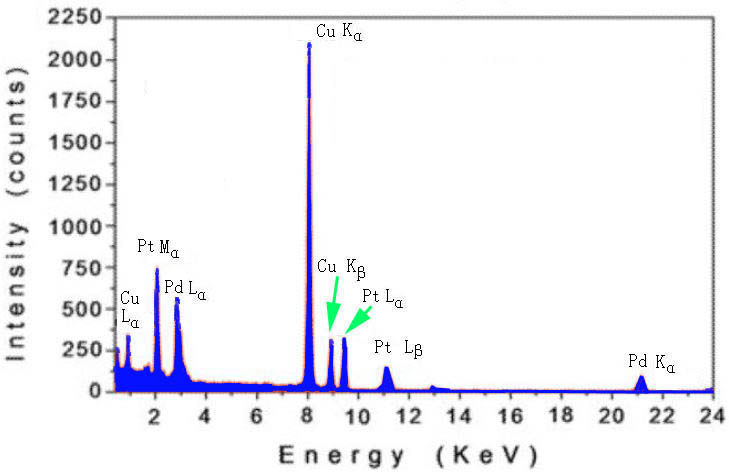
The EDS spectrum in Figure 1395 was taken from a nanoparticle (with Pt and Pd compositions of 50 at.% : 50 at.%) on holey carbon (C) film supported by a copper TEM grid. The copper signal in the spectrum was from the Cu grid (see page4638).
|
|
|||||