EELS of Mn (Manganese) - Practical Electron Microscopy and Database - - An Online Book - |
||||||||||||||||||||||||||||||||||||||||||||||
| Microanalysis | EM Book https://www.globalsino.com/EM/ | ||||||||||||||||||||||||||||||||||||||||||||||
The L2,3 ELNES of Mn (Mn2+, Mn3+, and Mn4+) shows multiplet structures of valences representing valence fingerprints, although Mn in some materials, such as sedimentary and surficial Mn minerals, is more likely to be Mn3+ and Mn4+. An isolated 3d transition Mn2+ ion has five degenerate 3d orbitals. The splitting of the L3 edge gives the signature of multiple valence states in mixed valence Mn-bearing minerals. The coordination of Mn is almost always octahedral. Mn materials are often fine grained heterogeneous mixtures containing more than one oxidation state. In Mn EELS profile, the L3 and L2 (L2,3) white lines correspond to electron excitations from the core states 2p3/2 and 2p1/2 to unoccupied 3d atomic orbitals, respectively, as shown in Figure 4345a. The two white lines are separated by ~10–12 eV due to the spin-orbit splitting of the Mn 2p core hole. The energy difference between these two peaks, ΔE(L2 - L3)] changes with the valence change in the Mn3+ to Mn4+ range.
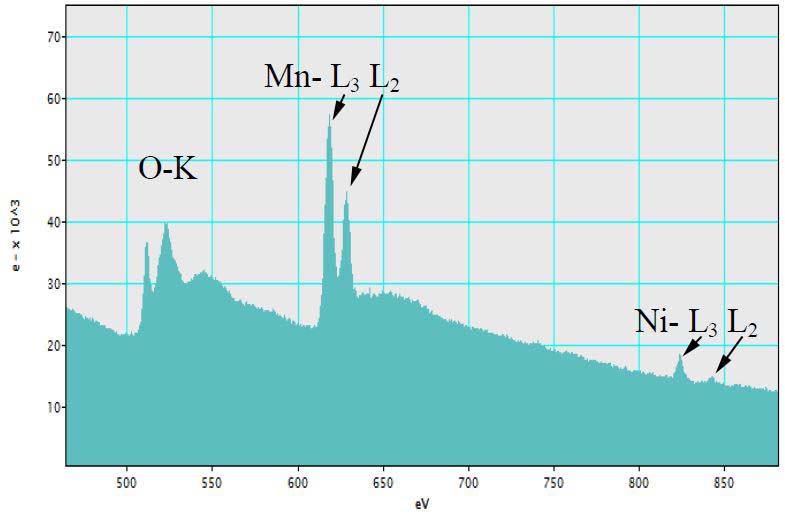
Figure 4345a. Schematic diagram of formation of L3 and L2 (L2,3) Mn white lines. Figure 4345b shows EELS spectrum of LiMn1.5Ni0.5O4 electrode material. The O-K , Mn-L and Ni-L edges are clearly presented.
Figure 4345b. EELS spectrum of LiMn1.5Ni0.5O4 electrode material. Adapted from [6] Figure 4345c shows the EELS profiles of ramsdellite, pyrolusite, cryptomelane (for different valence states), bixbyite, and manganite materials. The two Mn L2,3-edges shift to higher energy loss range with the increase of oxidation state. The Mn L3-edge structure of Mn3+ compounds is narrower and more symmetric than the edges for the Mn4+ valence states. Note that the shoulder of the most intense peak at ~644 eV has not been well-understood yet. Unlike Mn3+ compounds, different structural types of MnO2 (Mn4+ valence states) produce different widths of the Mn L3 edge. The main L3 peak from ramsdellite is apparently narrower than that of pyrolusite [2] because various arrangements of Mn octahedra give rise to different shapes of their EELS spectra [3]. The numbers beside the spectrum give the valence states of each material. The inset (A) in Figure 4345c shows the energy difference (ΔE(L2-L3)) between the two peaks of L2,3-edges, corresponding to the different valence states and indicating a linear trend but with large errors as a result of the Coster-Kronig Auger decay effect on the broadening of Mn L2 edges. Inset (B) shows the integrated Mn L2,3 white-line intensity ratios, I(L3)/I(L2), as a function of the Mn valence state.
Moreover, Table 4345a shows the energies (eV) of the Mn L3 and L2 edge peak maximum of some materials and the separation of the L3 and L2 peak maxima because of spin orbit splitting.
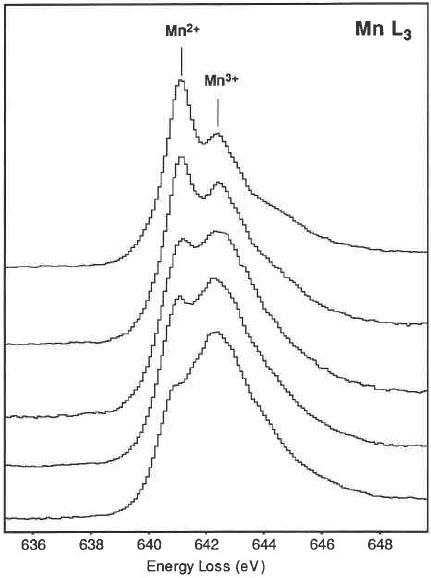
Three obvious changes in the Mn spectra with an increasing oxidation state (valence state) of the Mn can occur: Move to higher energy losses of the L3 peak maximum (See Table 4345a), a decrease in the I(L3)/I(L2) white line intensity ratio, and a characteristic shape change of the L2,3 edges. Figure 4345d shows L3 edges taken from hausmannite. The L3 edges are arranged from top to bottom with an increase in intensity of the Mn3+ peak corresponding to an increase in the amount of Mn3+.
Figure 4345d. L3 edges taken from hausmannite. [5] To minimize the electron-beam-induced chemical reduction of Mn4+ in Mn-containing minerals [1], each analysis has to be obtained in a low-dose condition using the lowest probe current while still producing a sufficient signal-to-noise ratio. This damage minimization can be done by spreading the electron beam for a low irradiation rate, e.g. smaller than 2 × 10⁴ e/nm2/s. At this condition, the acquisition time for each spectrum can be relatively long, e.g. 8–10 s. If the counts for a single spectrum are not sufficient to produce pronounced sharp peaks, a series of spectra should be summed to improve counting statistics such that the integrated dose for each accumulated spectrum is more than 2 × 10⁶ e/nm2. Table 4345b lists the distribution of Mn valence states from surface layer to bulk of a Li[Mn2]O4 (LMO) particle.
[1] Garvie, L.A.J. and Craven, A.J., (1994) Electron-beam-induced reduction of Mn4+ in manganese oxides as revealed by parallel EELS. Ultramicroscopy, 54, 83–92.
|
|
|||||||||||||||||||||||||||||||||||||||||||||
![distribution of Mn valence states from surface layer to bulk of a Li[Mn2]O4 (LMO) particle](image2/4345e.jpg)