Chapter/Index: Introduction | A | B | C | D | E | F | G | H | I | J | K | L | M | N | O | P | Q | R | S | T | U | V | W | X | Y | Z | Appendix
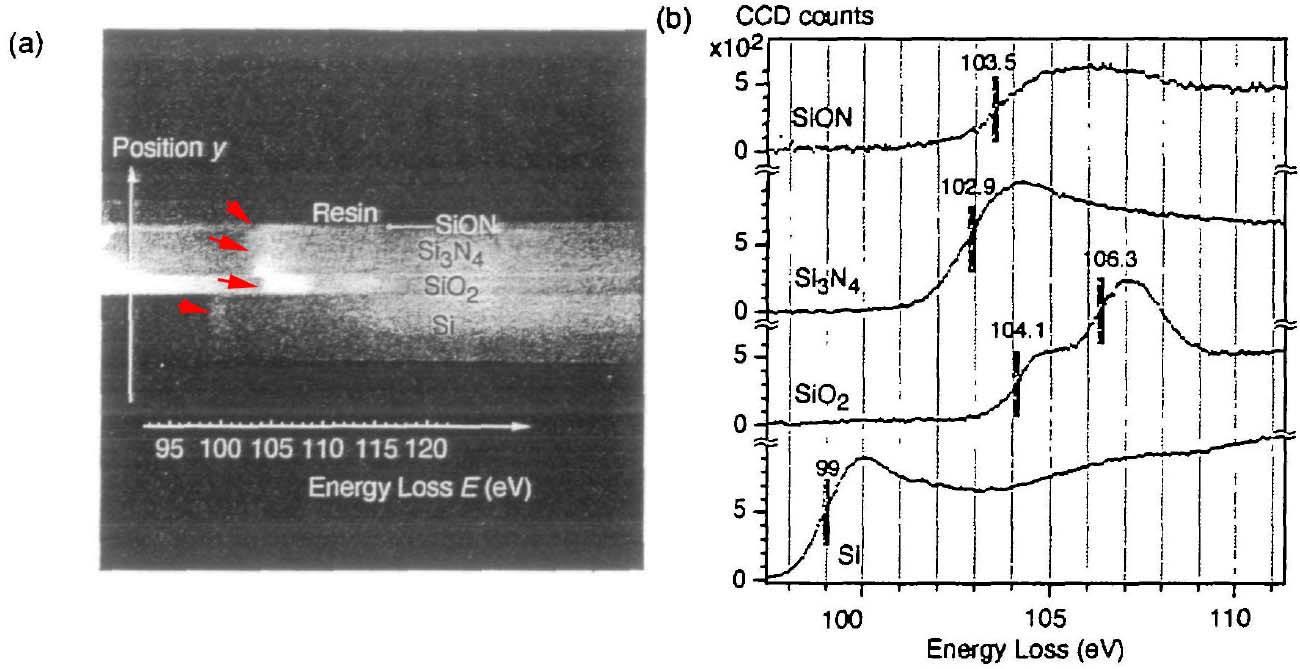
| The technique of spatially resolved electron energy-loss spectroscopy (SREELS) was first described and applied by Reimer et al. [3]. In their study, with an imaging energy filter in a TEM and a two-dimensional camera detector, they recorded spectrum images that contain a series of EELS simultaneously as a function of spatial coordinates in the specimen. The spatially resolved EELS method is less sensitive to the charges induced sample drift, radiation damage, and electron beam irradiation damage, which are usually severe in the STEM EELS line scan mode. SREELS is very useful, e.g. for nano-materials. Spatially resolved EELS has been performed using different types of spectrometers, such as Möllenstedt analyzer [1], Wien filter [2] and EFTEM [3 - 4]. Figure 4358 shows that the chemical shifts are revealed by spatially resolved EELS of Si-L2,3 edges. Figure 4358 (a) shows the 2-D (two-dimensional) spectrum image obtained by an energy filter. Note that this image shows the image contrast before background subtraction. The vertical axis corresponds to the location (y) in the layered materials of SiON. Si3N4, SiO2 and pure Si. The horizontal axis corresponds to the energy loss E. Energy dispersion used here was 0.051 eV per pixel. The energy range ΔE recorded in the 2-D spectrum image was 52 eV (= 88 - 141 eV in energy loss). Both the shift of the bright lines (shown by red arrows) in Figure 4358 (a) and the vertical lines in Figure 4358 (b) indicate the chemical shift of Si-L2,3 edges. Figure 4358 (b) shows energy loss spectra of each layer extracted from Figure 4358 (a). Here, the backgrounds of the spectra were subtracted.
Figure 4358. The spatially resolved EELS analysis of Si-L2,3 edges, (a) 2-D spectrum
[1] Watanabe H (1956) Experimental evidence for the collective nature
of the characteristic energy loss of electrons in solids. J. Phys. Soc.
|