=================================================================================
In the measurements related to electron energy loss, such as EELS (electron energy loss spectroscopy) and EFTEM (energy filtering transmission microscopy), the elemental information was extracted from energy loss signal corresponding to a characteristic inner-shell excitation. Signal to noise ratio (SNR) is an important parameter affecting the energy and spatial resolutions as well as detection limit and accuracy of such core-loss. There are a number of factors affecting the SNR parameter. For instance, a higher collection angle and a low inelastic cross section give a lower SNR in the EELS spectrum and result in weaker contrast features in EFTEM, as well as lead to a loss of resolution and a deterioration of the detection limits.
The signal to noise ratio can be optimized both by selecting the appropriate operating conditions on the microscope, such as illumination mode, objective apertures, defocus and magnification as well as on the energy filter itself, by choosing proper energy widths, size of entrance aperture, and energetic positions for the filtering windows.
For example, for three-window method, the SNR can be given by [1],
 --------------------------------------------------- [4935] --------------------------------------------------- [4935]
The statistical uncertainties and errors, associated with the background extrapolation (IB), are considered by the dimensionless parameter h (as shown in Figure 4719), which typically is in the range 2 – 30. The value of h depends strongly on the width of the fitting area, i.e. the energetic positions of the two pre-edge windows and the post-edge window, but it depends less on the fitting parameter r [1 - 2]. For a specific edge, the SNR of the EELS data is limited by the total signal, including the edge and the underlying background.
For an elemental image (e.g. EDS and EELS) taken from an uniformly thick TEM sample, the SNR is approximately equal to the ratio of mean signal (e.g. counts)/standard deviation (e.g. counts). Here, both the mean signal and the standard deviation are from the same uniformly thick area.
The pre-edge 2 window should be set close to the edge onset since this energy region influences the extrapolation most strongly. In this case, a large value of h and correspondingly large extrapolation errors leading to a low SNR can also be avoided. On the other hand, the interval between the two pre-edge windows should be as large as possible, making the fit statistically safer. In practice, however, if another edge from other elements is present within that range, one is restricted to smaller intervals.
Furthermore, the limited validity of the power law over wide fitting areas puts also constraints on the free variability of the positions of the pre-edge windows.
The remaining factors that can be widely changed in order to minimize h and thus, optimize the SNR are the energy range ΔE and the centre position of the post-edge window. The width should be not only small enough to avoid edge overlaps and significant background extrapolation errors but also should it be large enough to average out near-edge fine structure effects and provide adequate signals. The increasing fluctuations of the background may actually lead to a reduction of the SNR.
An interpretation of near edge fine structures is not possible if the signal-to-noise ratio is too low.
With increasing accelerating voltage:
-- Signal decreases, but background decreases even quicker,
-- To maximize the signal-to-background ratio, increase the accelerating voltage.
Furthermore, in EELS measurements, the correction of CCD channel-to-channel gain variation usually is not performed, but it is still important in order to obtain high detective quantum efficiency (DQE), to eliminate artifacts, and to measure an EEL spectrum without loss of signal-to-noise ratio, because each EEL spectrum can be shifted horizontally due to the energy instabilities. The correction of some energy instabilities (especially for low frequency instabilities) can be performed with scripts in Digital Micrograph.
In practice, EELS measurements with sufficient SNR at a common beam current of 10-100 pA and EELS collection optics of ~10-30% efficiency (without aberration correction) requires an acquisition time of ~0.1-1 s per pixel. For instance, Figure 4935a (a) shows Fe L2,3 (710 eV) energy loss edge of nano-crystalline mineral ferrihydrite (FHY) obtained at an acquisition time of 0.05 s per pixel which provided the maximum electron dose without internal atomic rearrangement in the material. In this spectrum, the noise level is too high. Therefore, a spectrum, as shown in Figure 4935a (b), with good SNR had to be obtained by summing such noisy
spectra of many pixels taken from identical materials.
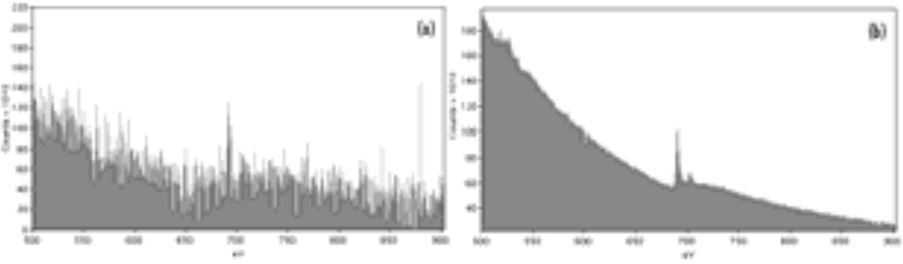
| Figure 4935a. (a) Fe L2,3 energy loss edge of nano-crystalline mineral ferrihydrite (FHY) obtained at an acquisition time of 0.05 s per pixel (electron dose: <104-105 electrons/nm2), and (b) A spectrum with good SNR obtained by summing such noisy
spectra in (a) of many pixels taken from identical materials. [3] |
Signal-to-noise (SNR) can be improved by:
i) Using small collection angles.
ii) By taking and summing a series of spectra obtained from different locations with identical
elements.
However, a consideration is that the magnitude of the entrance aperture is chosen as a compromise between maximizing both the signal-to-noise (SNR) and the signal-to-background ratio (SBR).
The decrease of the signal/background with larger collection semi-angles is shown in Figure 4935b. However, restricting the aperture means that a detectable signal becomes smaller, so that a compromise must be applied. It is then suggested that an optimum collection semi-angle is the order of 10 mrad.
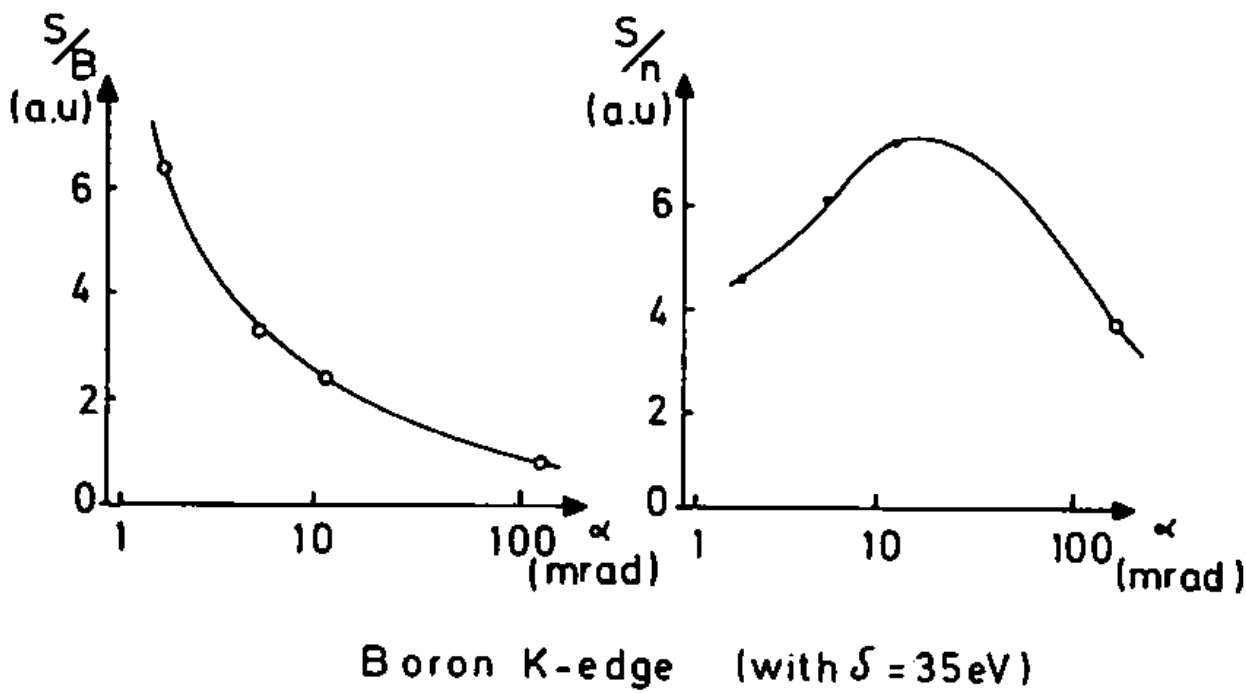
Figure 4935b. K-signal/background and K-signal/noise ratios for different collection semi-angles. [4] |
[1] Egerton, R. F., 1996. Electron Energy-loss Spectroscopy in the
Transmission Electron Micoscope. Plenum Press, New York.
[2] Berger, A., 1993. Abbildung von Elementverteilungen mit hoher
Ortsauflo¨sung im Transmissions-Elektronenmikroskop. Dissertation,
Technische Hochschule, Darmstadt, Germany.
[3] G. Vaughan, A.P. Brown, R. Brydson, K. Sader, A low electron fluence EELS study of Fe-coordination within ferrihydrite and phosphorous doped ferrihydrite nanoparticles, EMC 2008 14th European Microscopy Congress Volume 1 Instrumentation Methods Luysberg.
[4] C. Colliex, V. E. Cosslett, R. D. Leapman, P. Trebbia, Contribution of electron energy loss spectroscopy to the development of analytical electron microscopy, Ultramicroscopy, 1(4), (1976), 301-305.
|