EDS Background Noise & Modulation and Their Effects on Analysis - Practical Electron Microscopy and Database - - An Online Book - |
|||||||||||||||
| Microanalysis | EM Book http://www.globalsino.com/EM/ | |||||||||||||||
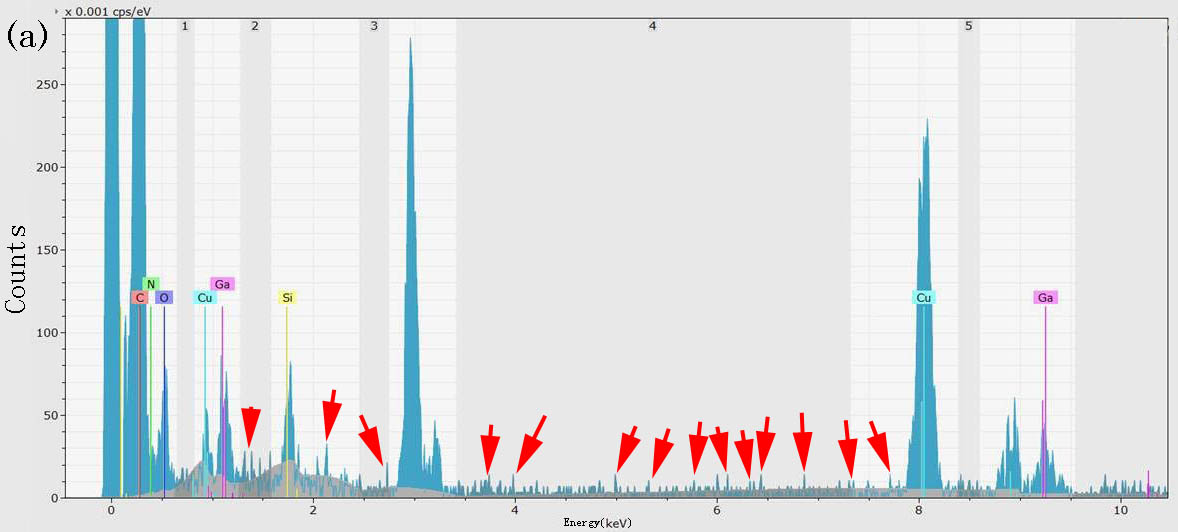
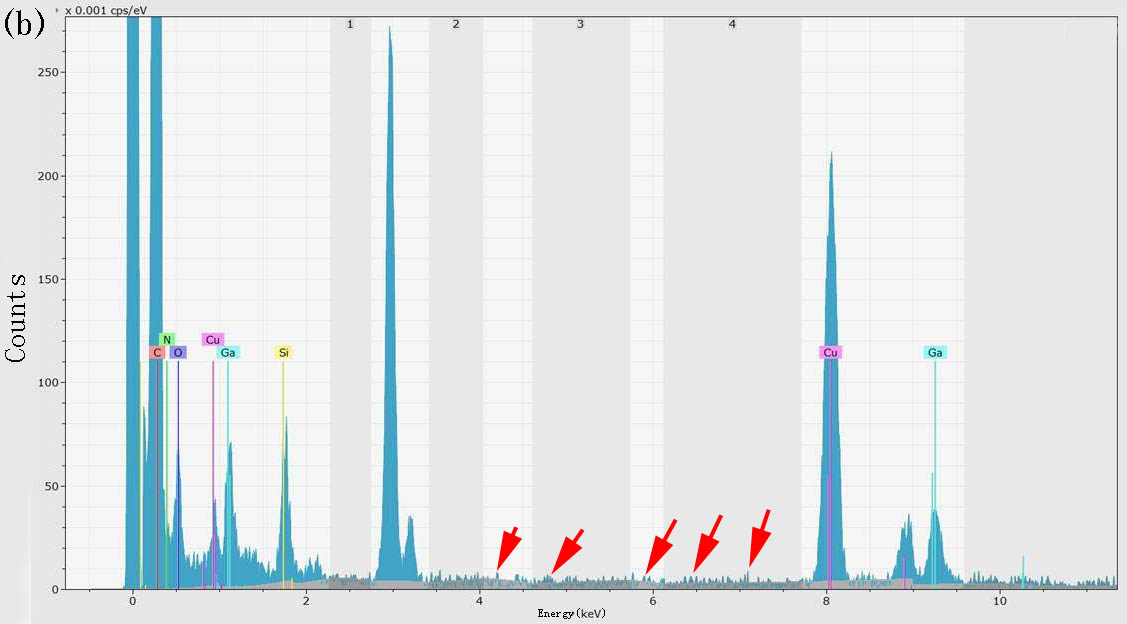
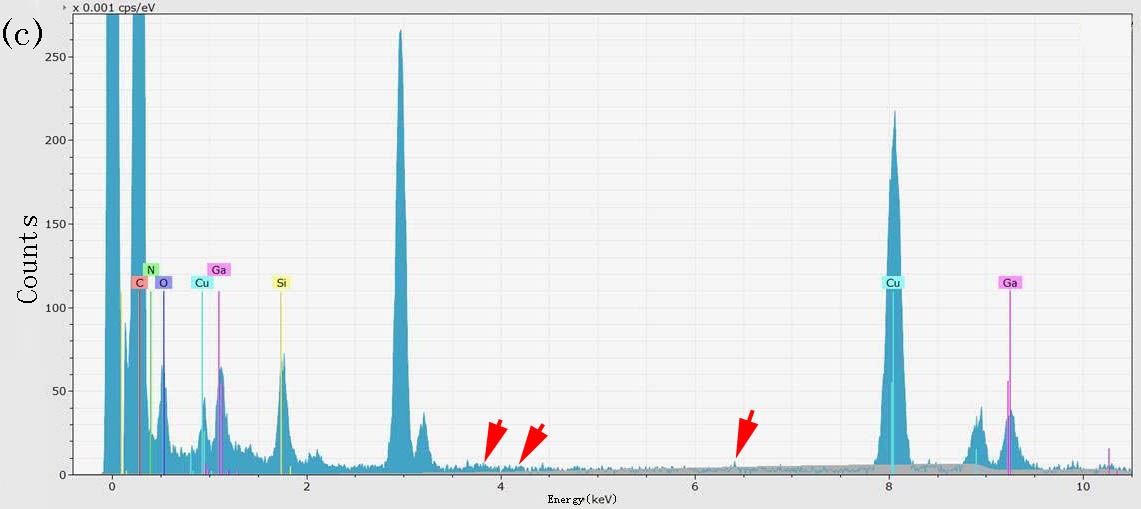
Figure 1727a shows X-ray spectra obtained with different acquisition times from complex materials containing C, N, O, Cu, Ga, and Si elements. The background in gray is calculated by the EDS software theoretically. The noise in the background is larger with shorter acquisition times. The software doesn't know which is noise and which is not in the backgrounds, so that the noise "peaks", e.g. pointed by the arrows, are considered as X-ray signals by the software at the corresponding energies, causing artificial intensities in both qualification and quantification. Note that the shapes of the simulated backgrounds are obviously different depending on the degree of the noises.
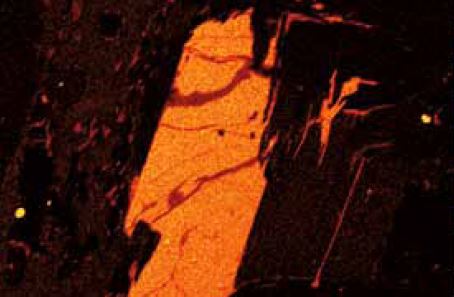
Figure 1727b (a) shows ROI (region of interest) intensity map of Ce-Lα at 4.837 keV, taken from a specimen that consists of Ce in FeTiO3 matrix. The small round phases in high intensity contains cerium (Ce) really. However, other false distributions from FeTiO3 also display an intermediate intensity due to the significantly high background modulation from FeTiO3. Figure 1727b (b) shows the real Ce-Lα distribution obtained from Figure 1727b (a) by QMap function in Bruker QUANTAX EDS software. This function applies ZAF-correction after using peak-to-background (P/B) model [2], in combination with deconvolution.
Automated peak identification process is sensitive to the noise in the spectral background because random groupings of background counts can mimic a characteristic X-ray peak when the threshold is set too low. Figure 1727c was obtained when a short data acquisition time was used. The four peaks (Fe Kα, Fe Kβ, Fe Lα and C K) were really generated from the analyzing material; however, the other peaks (W, P, Pd, Ag, Ca and La) were false, which were misidentified from the noise in the background. Different artificial trace elements will show up because the noise in the background changes, when the data acquisition time increases. When the acquisition time is long enough so that P ≥ 3 (NB)1/2, the artificial peaks and thus the peak misidentification will then be eliminated. However, on many software, users are able to input their statistical threshold to define what constitutes a significant peak above the random noise in the background.
[1] A Bruker QUANTAX EDS Note.
|
|
||||||||||||||