
Chapter/Index: Introduction | A | B | C | D | E | F | G | H | I | J | K | L | M | N | O | P | Q | R | S | T | U | V | W | X | Y | Z | Appendix
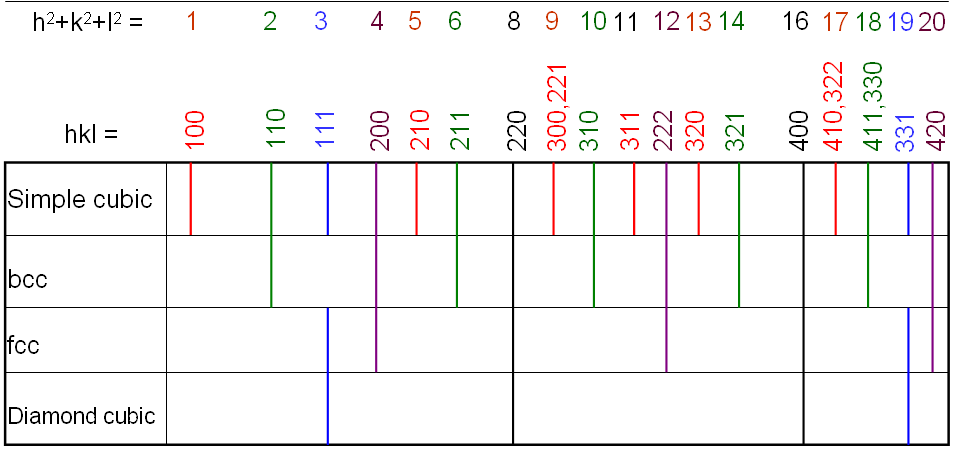
| Based on the periodicity of the observed reflections in diffraction patterns or profiles, it is possible to distinguish the crystal structures. For instance, Figure 2507 shows the comparison of XRD (X-ray diffraction) results from different cubic crystal structures. Here, the three integers (h, k, and l) represent the Miller indices.
Figure 2507. Comparison of XRD results from different cubic crystal structures.
Table 2507a shows the d-ratios for cubic crystal, where d1 and d2 are d-spacings. Table 2507a. d-ratio for cubic crystal
Table 2507b. Some symmetrical diffraction patterns of cubic crystals.
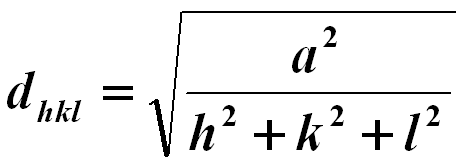
The lattice spacing of cubic structures may be given by, where,
|
 ------------------------------- [2507]