EDS and WDS Measurements of Barium (Ba) - Practical Electron Microscopy and Database - - An Online Book - |
||||||
| Microanalysis | EM Book https://www.globalsino.com/EM/ | ||||||
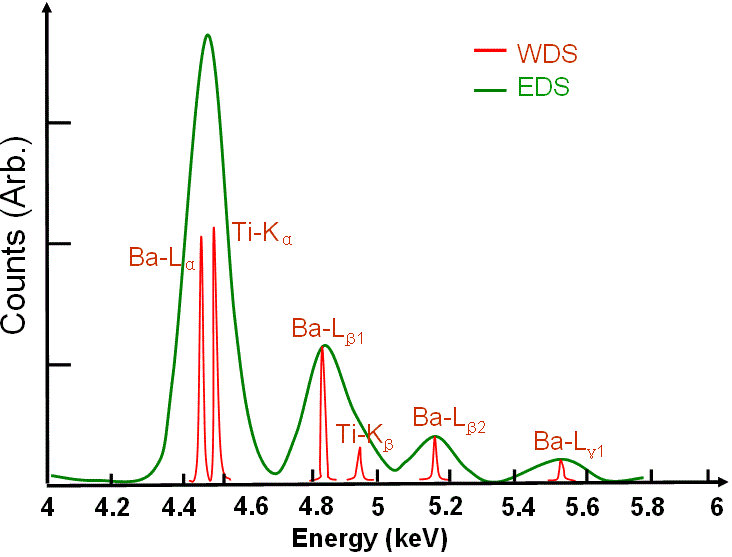
The EDS profile of BaTiO3 system shown in Figure 3107a presents an example of EDS peak overlap. However, the FWHM of the WDS peaks is only a few eV because the energy resolution of the wavelength spectrometer is 5-10 eV. In this case, peak overlap in WDS is not a problem.
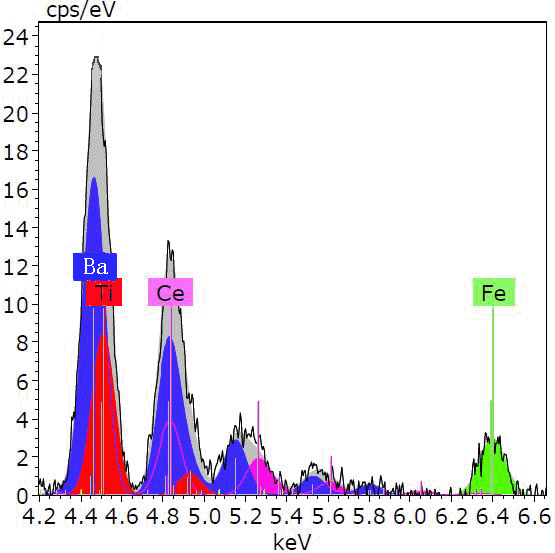
Figure 3107a. EDS and WDS profiles of BaTiO3. The green spectrum presents a standard EDS of of BaTiO3, while the red one presents a standard WDS. EDS shows the overlapped Ba Lα-Ti Kα and Ba Lβ1-Ti Kβ peaks. Figure 3107b shows a deconvoluted X-ray spectrum taken from a material containing Ba, Ti, Ce, and Fe elements. The different colored peaks represent the contribution of the various elements. The grey area is the background corrected spectrum which is the sum of all the deconvoluted lines.
[1] T. Salge, R. Neumann, C. Andersson, M. Patzschke, Advanced Mineral Classification Using Feature Analysis and Spectrum Imaging with EDS, 23rd International Mining Congress & Exhibition of Turkey, 16-19 April, 357, 2013.
|
|
|||||