=================================================================================
On the one hand, similar to EELS, the peak-to-background ratio (P/B ratio) in EDS increase with the accelerating voltages from 100 kV to 400 kV, resulting in an increase in the detection sensitivity of any trace elements; but on the other hand, low accelerating voltage electron beams can enhance the sensitivities for both EELS and EDS because the reduced the acceleration voltage increases the ionization cross-section, which is determined by the overvoltage ratio. Furthermore, the spatial resolution for both the EDS and EELS analyses is improved with the accelerating voltages, since the incident electron beam spread decreases with an increase in the accelerating voltage.
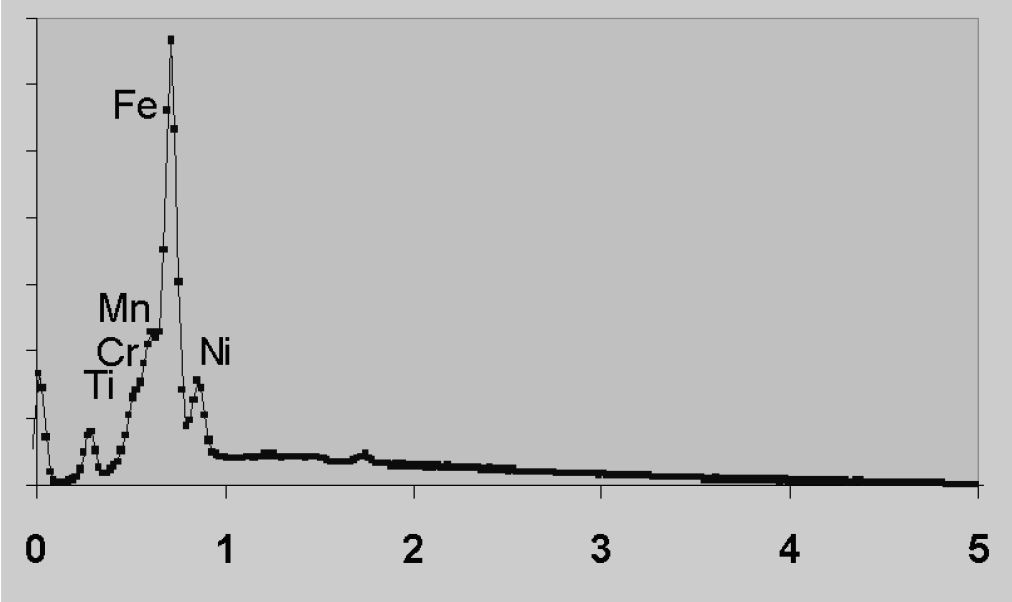
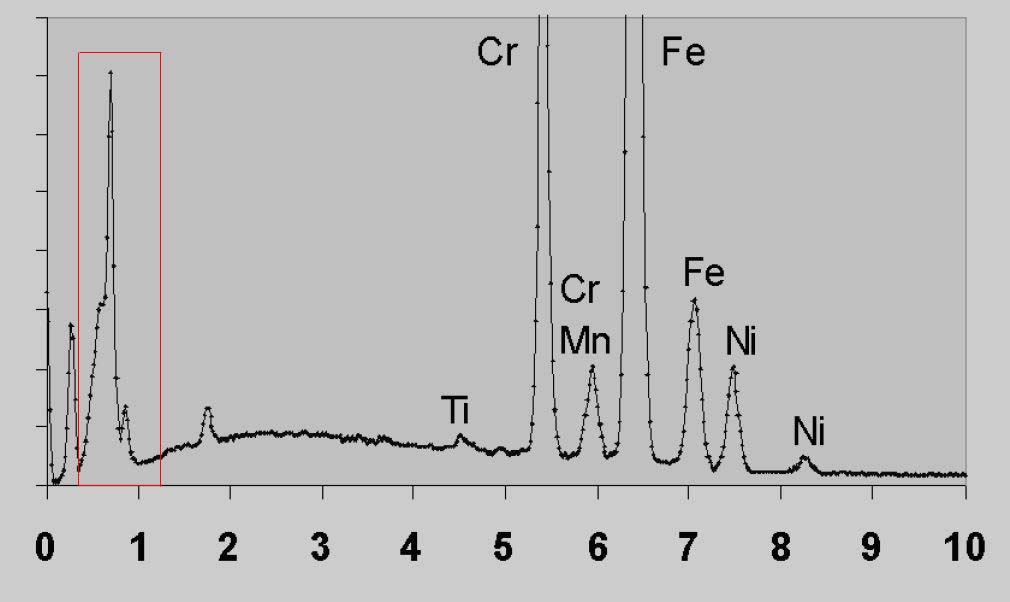
EDS measurements with low- and high-energy incident electrons have been discussed at page4610. Figure 3411 shows the EDS measurements of a Ti-Cr-Mn-Fe-Ni material, performed at accelerating voltages of 5 kV and 20 kV, respectively, and Table 3411 lists the comparison of the two measurements.
| Figure 3411. EDS measurements of a Ti-Cr-Mn-Fe-Ni material, performed at accelerating voltages of 5 kV (a) and 20 kV (b), respectively. L lines in (a) and K lines in (b) of all the elements are labeled
(refer to page4675). For the case (b), L lines of the elements are in the red box. Adapted from [1] |
| Table 3411. Comparison of the two EDS measurements in Figure 3411, performed at accelerating voltages of 5 kV and 20 kV, respectively. |
| Items |
5 keV |
20 keV |
| Spectrum processing task |
Formidable |
Easier |
| Excited X-ray lines |
L lines for all the elements present between 0 eV
and 1 keV |
K lines of all the elements are clearly visible between 4 eV
and 9 keV |
| Background |
Background bulges beneath
the peaks |
Fairly flat |
| Peak overlap |
All L lines overlap |
Some kβ/kα overlap |
| Clean X-ray lines |
|
kα line |
| Accuracy |
Lower |
Higher |
| L lines |
Only available lines |
Not used since K lines are available |
[1] Peter J. Statham, Limitations to Accuracy in Extracting Characteristic Line Intensities From X-Ray Spectra, J. Res. Natl. Inst. Stand. Technol. 107, 531–546 (2002).
|