=================================================================================
Hydrogenic model and Hartree-Slater model give good results for evaluating the K-shell excitation cross-section. A comparison of K-edge and cross-section profiles for low atomic number (Z) elements [1] shows that the cross-section profiles present the K-edge roughly for an edge where the fine structures are important, e.g. for boron nitride (BN).
Figure 3414a (a) shows a HAADF-STEM image of single-layered h-BN (hexagonal boron-nitride) and Figure 3414a (b) is a corresponding atomic model where a EELS linescan has been recorded, shown in (c) and (d). The STEM contrast of the N and B locations is determined by the atomic number, called Z-contrast. Figure 3414a (c) and (d) shows the EELS profiles of the boron K-edge and nitrogen K-edge signals, respectively. The N K-edge intensity does not go down to zero even between two nitrogen atoms because of EELS signal delocalization [2]. The large probe tail and mechanical instabilities such as the specimen drift during the line scan may also partially contribute to the nonzero intensity but this should not be a dominant effect because the simultaneously recorded STEM profile clearly shows well-separated atoms similar to the STEM signal presented in Figure 3414a (a).
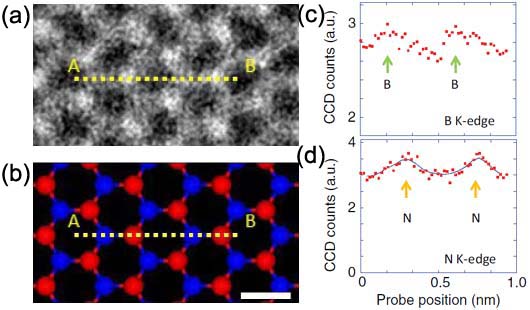
Figure 3414a. (a) A HAADF-STEM image of single-layered h-BN (hexagonal boron-nitride), (b) A corresponding atomic model where an EELS linescan was recorded (red: nitrogen, blue: boron), and (c) and (d) the EELS profiles of the boron K-edge and nitrogen K-edge signals. Adapted from [3]
Figure 3414b shows a boron monovacancy [4, 5] (indicated by the darkest contrast in (a)), in single-layered h-BN (hexagonal boron-nitride), induced by the knock-on effect.
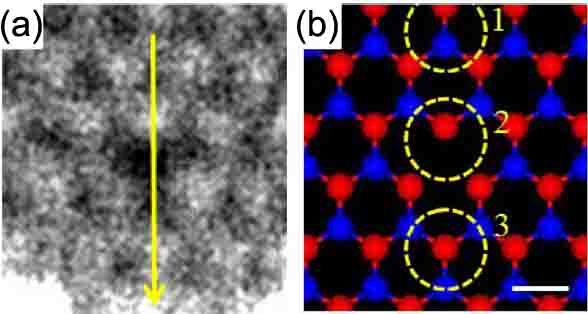
Figure 3414b. (a) A boron monovacancy shown by the darkest contrast in the HAADF-STEM image of single-layered h-BN and (b) A corresponding atomic model (red: nitrogen, blue: boron). Adapted from [3]
EEL spectrum shown in Figure 3414c was obtained from BN nanotubes prepared by continuous laser ablation of BN targets. It presents
five different edges, including B, C, Ca, N and O.
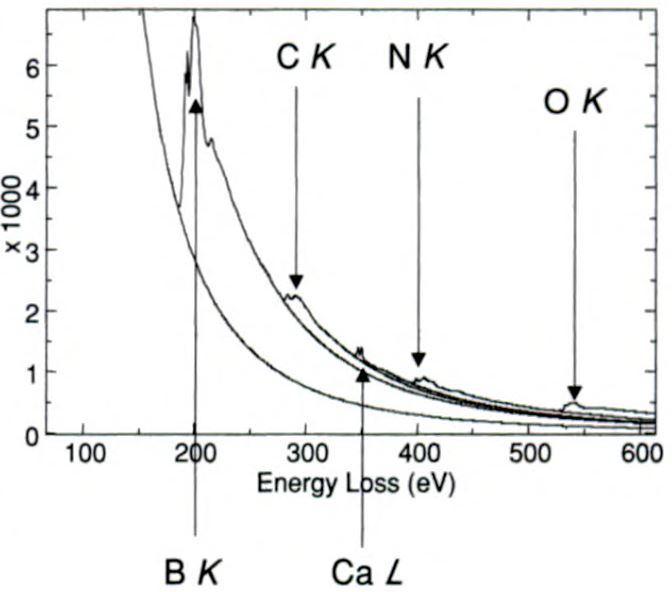
| Figure 3414c. EEL spectrum obtained from BN nanotubes prepared by continuous laser ablation of BN targets. [6] |
[1] Ahn C. and Rez P., Ultramicroscopy 17 (1985) 105.
[2] D. A. Muller and J. Silcox, Ultramicroscopy 59, 195 (1995).
[3] Kazu Suenaga, Haruka Kobayashi, and Masanori Koshino, Core-Level Spectroscopy of Point Defects in Single Layer h-BN, Physical Review Letters, 108, 075501 (2012).
[4] C. Jin et al., Phys. Rev. Lett. 102, 195505 (2009).
[5] J. Meyer et al., Nano Lett. 9, 2683 (2009).
[6] Nan Yao, Zhong Lin Wang, Handbook of Microscopy for Nanotechnology, 2005.
|