EELS Measurement of Zirconium (Zr) - Practical Electron Microscopy and Database - - An Online Book - |
|||||||||||||||||||||||||
| Microanalysis | EM Book https://www.globalsino.com/EM/ | |||||||||||||||||||||||||
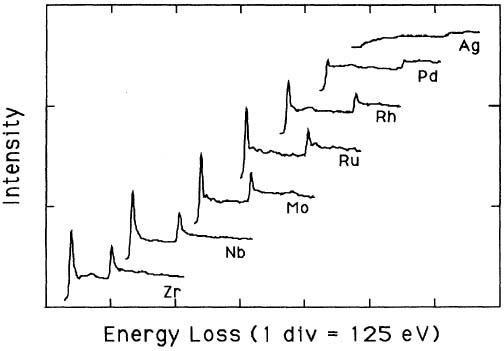
Pearson et al. [1] experimentally and theoretically (based on one-electron Hartree-Slater calculations) found that the intensities of L2,3 white lines for most of the 3d and 4d transition metals decreased nearly linearly with increasing atomic number, reflecting the filling of the d states. Figure 3420a shows the deconvoluted and background-subtracted L2,3 energy-loss spectra for the 4d transition metals. The edge energies are not shown in order to present all the spectra on the same figure, while the intensities of the white lines are scaled simultaneously for all elements.
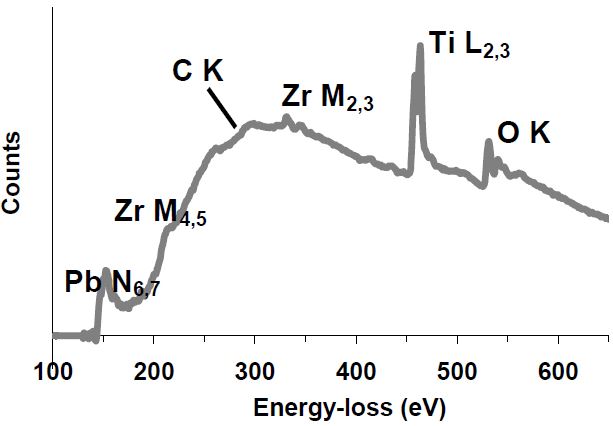
Figure 3420a. The deconvoluted and background-subtracted L2,3 energy-loss spectra for the 4d transition metals. [1] Figure 3420b shows an EEL spectrum taken from a lead zirconate titanate (Pb(Zr0.3Ti0.7)O3, PZT) thin film.
[1] D. H. Pearson, C. C. Ahn, and B.Fultz, White lines and d-electron occupancies for the 3d and 4d transition metals, Physical Review B, 47(14), (1993) 8471-8478.
|
|
||||||||||||||||||||||||