=================================================================================
EELS data on the occupancies of 3d and 4d states can clarify many fundamental problems related to the electronic properties of transition metal alloys. For 3d transition metals and their alloys, L2,3 edges of EELS are characterized by two narrow, intense, and sharp peaks, called “white lines”. These white lines are induced by the excitations of 2p1/2 and 2p3/2 core electrons to unoccupied d-like states near the Fermi level (quasi-atomic dipole-allowed transitions), i.e. an initial state from 2p63dn to final states of the form 2p53dn+1. In detail, the edges L3 and L2 are formed because the spin quantum number, s, couples to the orbital angular momentum, l, giving the total angular momentum, j = l + s and thus, the transitions from 2p3/2 (j = 3/2) form the L3 edge and 2p1/2 (j = 1/2) form the L2 edge. The white-line intensities represent the unoccupied 3d density of states (DOS). The high intensity of the 3d transition metal L2,3 edges is due to the high density of unoccupied 3d states. The L2,3 edges from the 3d transition elements exhibit structures that are sensitive to the valence state of the metals. The L3 edge for a specific 3d transition metal exhibits a chemical shift toward higher energy losses with an increase in oxidation state.
Pearson et al. [1] experimentally and theoretically (based on one-electron Hartree-Slater calculations) found that the intensities of L2,3 white lines for most of the 3d and 4d transition metals decreased nearly linearly with increasing atomic number, reflecting the filling of the d states. Figure 3435a shows the deconvoluted and background-subtracted L2,3 energy-loss spectra for the 3d transition metals. The edge energies are not shown in order to present all the spectra in the same figure, while the intensities of the white lines are scaled simultaneously for all elements.
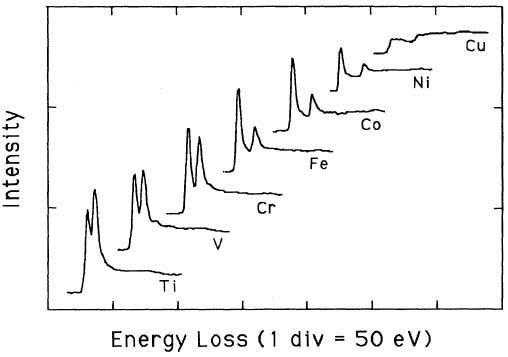
Figure 3435a. The deconvoluted and background-subtracted L2,3 energy-loss spectra for the 3d transition metals. [1]
Figure 3435b shows EEL spectra of TiO2, V, Cr, Fe2O3, CoO, NiO, and Cu with L2,3 energy-losses for the 3d transition metals. The chemical shift of O element in the different oxides (TiO2, Fe2O3, CoO, and NiO) is also indicated in the figure. The main edges of Ti, V, Cr, Fe, Co, Ni and Cu, and their edge onsets are listed in Table 3435.
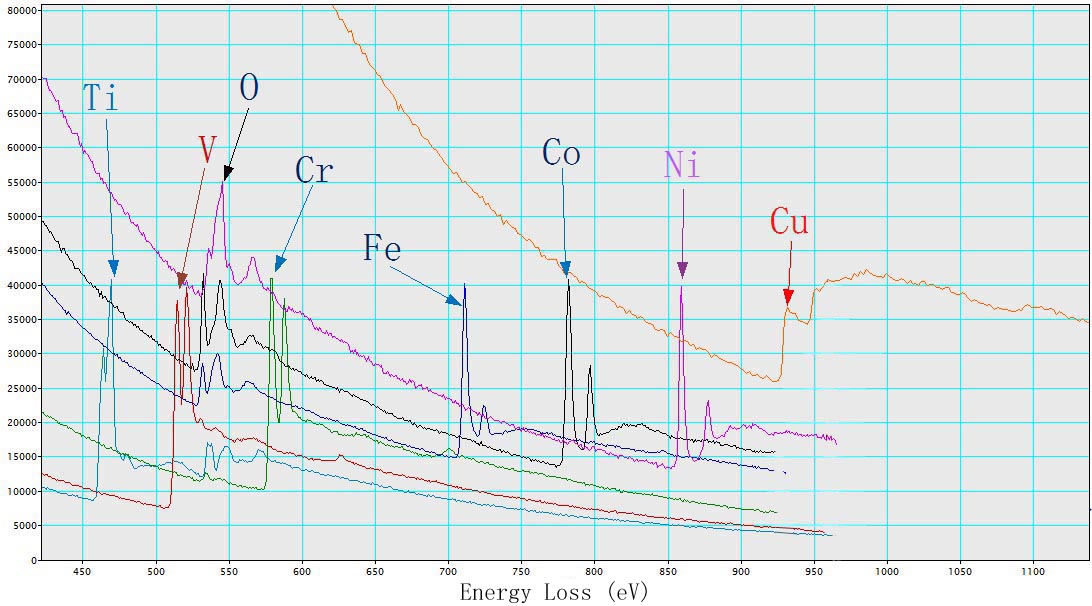
| Figure 3435b. EEL spectra of TiO2, V, Cr, Fe2O3, CoO, NiO, and Cu. |
Table 3435. Main edges of Ti, V, Cr, Fe, Co, Ni, and Cu, and their edge onsets.
| Atomic number |
Element |
Edge(s) |
Edge onsets (eV) |
| 22 |
Ti |
L2,3 |
455 |
| 23 |
V |
L2,3 |
513 |
| 24 |
Cr |
L2,3 |
575 |
| 26 |
Fe |
L2,3 |
710 |
| 27 |
Co |
L2,3 |
779 |
| 28 |
Ni |
L2,3 |
855 |
| 29 |
Cu |
L2,3 |
935 |
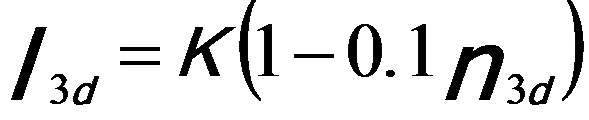
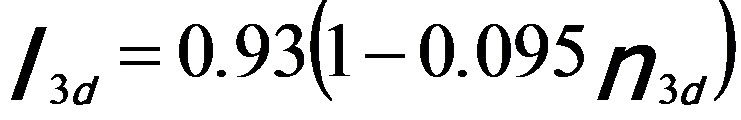
Similar to white line analysis of 4d metals, in order to quantify the correlation between the intensities of the white lines and the d holes (or occupancy), the intensities of the white lines are normally obtained by subtracting the background from the signal. As an example, Figure 3435c illustrates the method for isolating and normalizing the white lines for 3d transition V (vanadium) metal. The background intensity is modeled by double step functions in the threshold regions. A straight line over a range of ~ 50 eV is fit to the background intensity immediately following white line L2. A linear correlation of the normalized white line intensity, I3d, with 3d occupancy, n3d (see Tables in page4697), is obtained with a fit given by,[1]
 -------------------------- [3435a] -------------------------- [3435a]
where, the constant, K, is arbitrary and depends on the specific normalization scheme.
By fitting the constant with the experimental data, the normalized white-line intensities for steps at peaks (Equation 3435b) and at onsets (Equation 3435c) can be given by, [1]
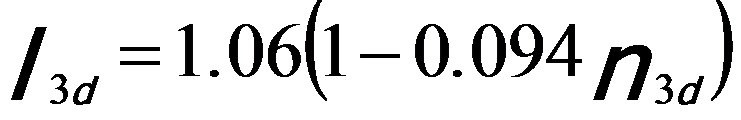 -------------------------- [3435b] -------------------------- [3435b]
 -------------------------- [3435c] -------------------------- [3435c]
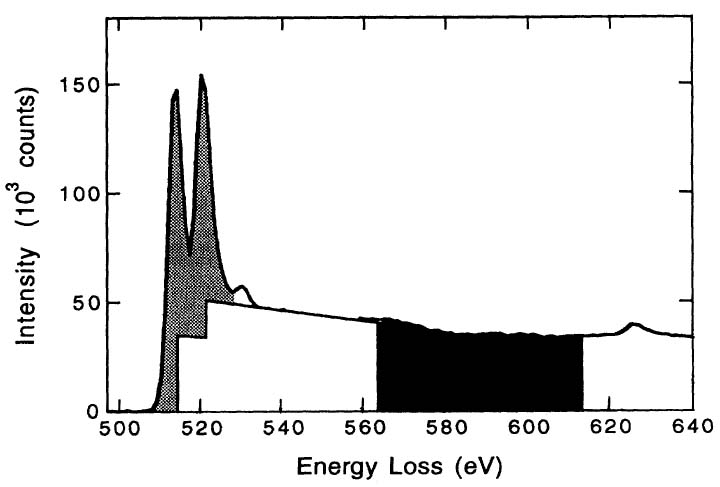
Figure 3435c. Schematic illustration of L2,3 edges of V transition metal for
background subtraction and intensity normalization. [1]
Fine structure of K-edge pre-peak of 3d transition elements is not easily observable because of the greater core-hole lifetime broadening associated with the K edge than with the L2,3 edges. The broadening on the L2,3 edges of the 3d transition elements is typically 0. 1-0.3 eV, while it is three to four times larger on the corresponding K edge.
The ratio of the L3 to L2 white-line intensity across the 3d series is theoretically expected to be 2:1 due to the statistical radio of the initial states (four 2p3/2 electrons and two 2p1/2 electrons). In practice this ratio varies with atomic number (or d band occupancy) from 1:1 to about 4:1 [2].
Figure 3435c shows the first method to remove the background, while Figure 3435d describes the second method to remove the background. In the second method, the first minimum was connected by straight lines.
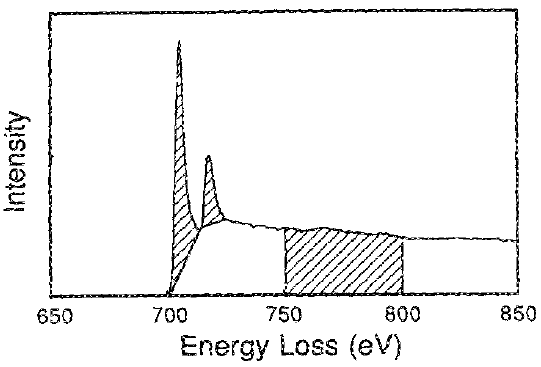
Figure 3435d. EEL spectrum for pure iron (Fe) showing the isolated white
line intensities and the normalization energy window 50 eV width.
[3]
Similar to Equation 3435c, Figure 3435e shows the normalized sum of the L2,3 white line intensities versus 3d occupancy for the seven 3d transition metals.
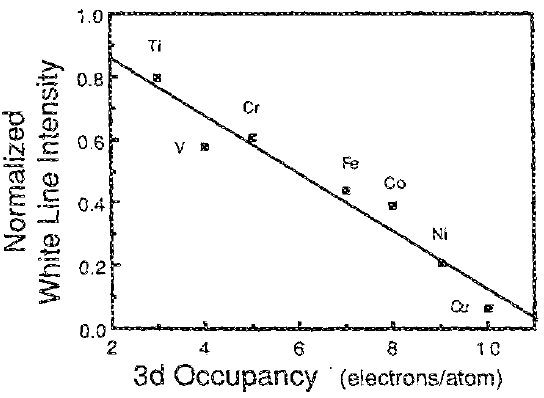
Figure 3435e. The normalized sum of the L2,3 white line intensities versus 3d occupancy for the seven 3d transition metals.
[1] D. H. Pearson, C. C. Ahn, and B.Fultz, White lines and d-electron occupancies for the 3d and 4d transition metals, Physical Review B, 47(14), (1993) 8471-8478.
[2] R. D. Leapman and L. A. Grunes, Phys. Rev. Lett. 45, 497 (1980).
[3] Pearson, D. H. and Fultz, B. and Ahn, C. C. Measurements of 3d state occupancy in transition metals using electron energy loss spectrometry. Applied Physics Letters, 53 (15), (1988) 1405-1407.
|