Plot Data into the Same Graph/Figure/Image from Different csv Files Import Multiple CSV Files and Concatenate into One DataFrame - Python for Integrated Circuits - - An Online Book - |
||||||||
| Python for Integrated Circuits http://www.globalsino.com/ICs/ | ||||||||
| Chapter/Index: Introduction | A | B | C | D | E | F | G | H | I | J | K | L | M | N | O | P | Q | R | S | T | U | V | W | X | Y | Z | Appendix | ||||||||
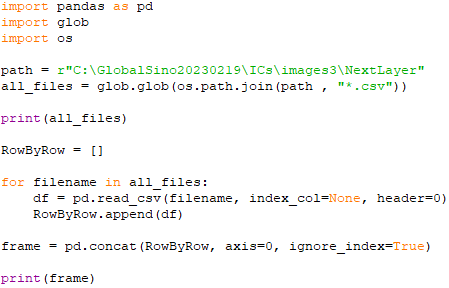
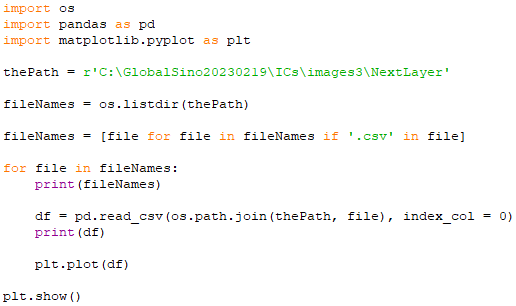
================================================================================= Import few CSV files and concatenate into one DataFrame vertically. Code: ============================================ Import multiple CSV files and concatenate into one DataFrame. Code: ============================================ Import multiple CSV files and concatenate into one DataFrame. Code: ============================================ Collect all the file paths in a list, and then append them row by row. Code: ============================================ Append cvs files column by column, and then plot data into the same graph/figure/image from different csv files. Code: ============================================ Create a DataFrame with headers only, and then add a row into the DataFrame (Code):Output: ============================================
|
||||||||
| ================================================================================= | ||||||||
|
|
||||||||


