Plot from CSV File/DataFrame - Python for Integrated Circuits - - An Online Book - |
||||||||
| Python for Integrated Circuits http://www.globalsino.com/ICs/ | ||||||||
| Chapter/Index: Introduction | A | B | C | D | E | F | G | H | I | J | K | L | M | N | O | P | Q | R | S | T | U | V | W | X | Y | Z | Appendix | ||||||||
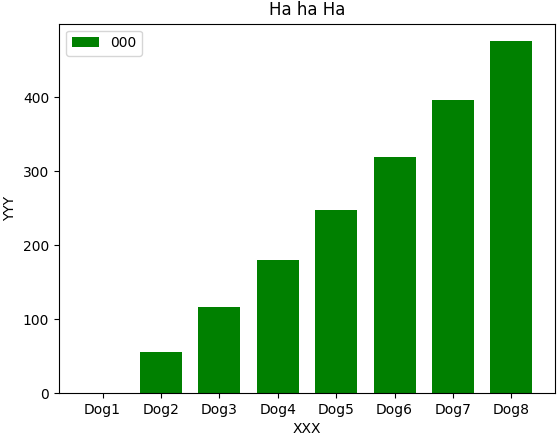
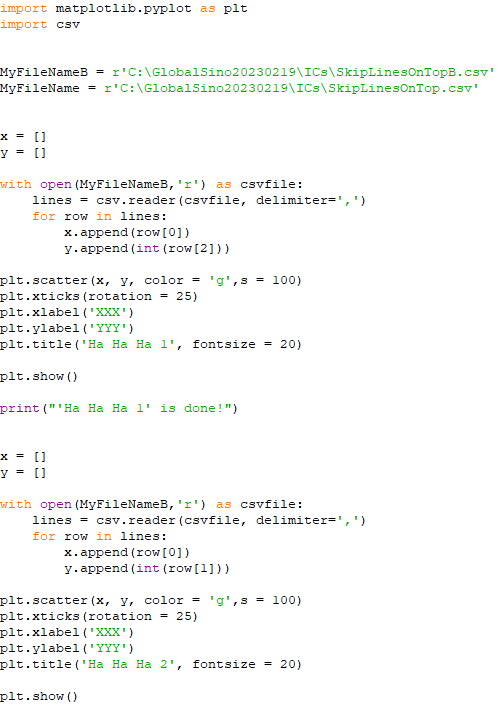
================================================================================= Plot figures from dataFrame: page4211, page4735, page4278, page4500. ============================================ Plot data from multiple sets of data in a csv files: code: ============================================ Plot histogram with seaborn: code: ================================================ Plot from csv files. Code: ============================================ Plot from csv files. Code: ============================================ Plot from csv files. Code: ============================================ Plot from csv files. Code: ============================================ Plot from csv files by removing the top rows. Code: ============================================ Plot from csv files by removing the top rows. Code: ============================================
|
||||||||
| ================================================================================= | ||||||||
|
|
||||||||


