|
||||||||
Hide x-Axis Tick Labels where x Values are Under Certain Conditions - Python Automation and Machine Learning for ICs - - An Online Book - |
||||||||
| Python Automation and Machine Learning for ICs http://www.globalsino.com/ICs/ | ||||||||
| Chapter/Index: Introduction | A | B | C | D | E | F | G | H | I | J | K | L | M | N | O | P | Q | R | S | T | U | V | W | X | Y | Z | Appendix | ||||||||
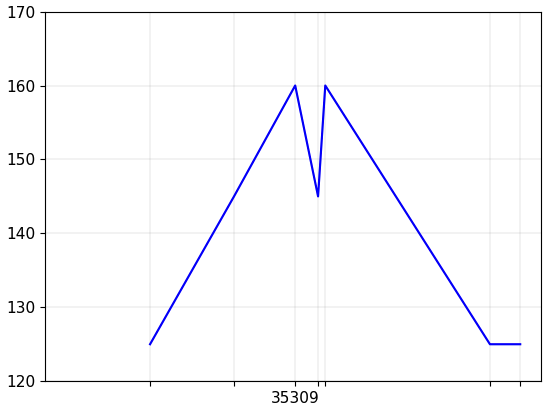
================================================================================= Hide x-axis tick labels where x values are under certain conditions. Code: Output: Output from "x_ticks_labels = [str(m) if 1400 < t or t < 1500 else '' for m, t in zip(x, df['tax'])]": Output from "x_ticks_labels = [str(m) if 140 < t and t < 150 else '' for m, t in zip(x, df['tax'])]": In the case above, this expression sets the x-axis tick labels to the mileage values if the corresponding tax values are between 140 and 150. Otherwise, it sets the tick label to an empty string, effectively hiding it. Output from "x_ticks_labels = [str(m) if 140 > t or t > 150 else '' for m, t in zip(x, df['tax'])]": Others:
=========================================== Show only one x-axis tick label after hiding three x-axis tick labels and if t > 150. Code: Output: ===========================================
|
||||||||
| ================================================================================= | ||||||||
|
|
||||||||


