Epochs and Sample Size
- Python for Integrated Circuits - - An Online Book - |
||||||||
| Python for Integrated Circuits http://www.globalsino.com/ICs/ | ||||||||
| Chapter/Index: Introduction | A | B | C | D | E | F | G | H | I | J | K | L | M | N | O | P | Q | R | S | T | U | V | W | X | Y | Z | Appendix | ||||||||
================================================================================= The relationship between epochs and sample size in machine learning is primarily influenced by the following factors:
The relationship between epochs and sample size is not fixed but rather influenced by several factors, including dataset size, model complexity, learning rate, convergence criteria, data noise, and regularization. It's essential to experiment and tune these factors to find the optimal balance that allows your model to converge efficiently without overfitting. Cross-validation and monitoring validation metrics can help guide this process. Machine learning relationships between sample size and epochs are typically not modeled using simple mathematical equations because the relationship can be highly complex and problem-specific. The relationship often depends on various factors, including the dataset, the model architecture, the learning algorithm, and the convergence criteria. Therefore, there isn't a single mathematical equation that accurately captures this relationship in all situations. However, you can use empirical modeling or data-driven approaches to understand how sample size and epochs interact for a specific problem. Here's a general process for empirically modeling the relationship:
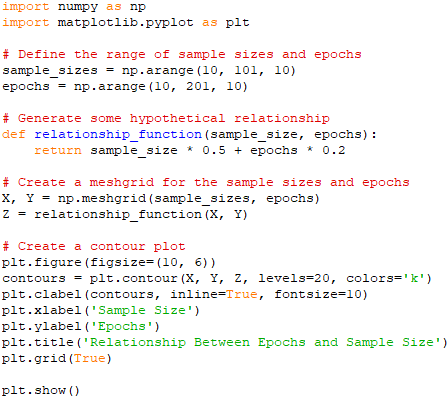
Therefore, creating an equation to illustrate the relationship between epochs and sample size in a machine learning context can be challenging because it depends on various factors such as the specific machine learning algorithm, model complexity, dataset, and problem domain. The relationship is often empirical and data-dependent. ============================================ Python script to illustrate the relationship between epochs and sample size. Code: In this script:
Note that in practice, the relationship between epochs and sample size may not be as straightforward as shown in this example. You may need to gather empirical data and analyze it to determine the actual relationship for your specific problem. On the other hand, the third number (Z-value), which corresponds to the contour lines, represents the value of the hypothetical relationship function at that specific combination of sample size and epochs:
In the script example, we used a simple linear relationship function for illustration, so the Z-values represent the hypothetical relationship value between sample size and epochs. However, in practical applications, the Z-values could represent various metrics or quantities of interest, such as model accuracy, loss, processing time, or any other relevant metric that depends on both sample size and epochs. The contour plot helps you visualize how the Z-value changes as you vary both sample size and epochs. Contour lines that are close together indicate regions where the Z-value changes rapidly, while contour lines that are further apart indicate regions with more gradual changes in the Z-value. This visualization can help you understand the relationship between sample size and epochs and how it affects the Z-value of interest. In this example above, we assume a linear relationship for simplicity, ajust this equation based on the relationship you want to illustrate. For example, you might use a logarithmic relationship, polynomial, etc. You can also use empirical data if available. ============================================
|
||||||||
| ================================================================================= | ||||||||
|
|
||||||||