Plot Pixel Intensities (Histogram) along a Line of an Image - Python for Integrated Circuits - - An Online Book - |
||||||||
| Python for Integrated Circuits http://www.globalsino.com/ICs/ | ||||||||
| Chapter/Index: Introduction | A | B | C | D | E | F | G | H | I | J | K | L | M | N | O | P | Q | R | S | T | U | V | W | X | Y | Z | Appendix | ||||||||
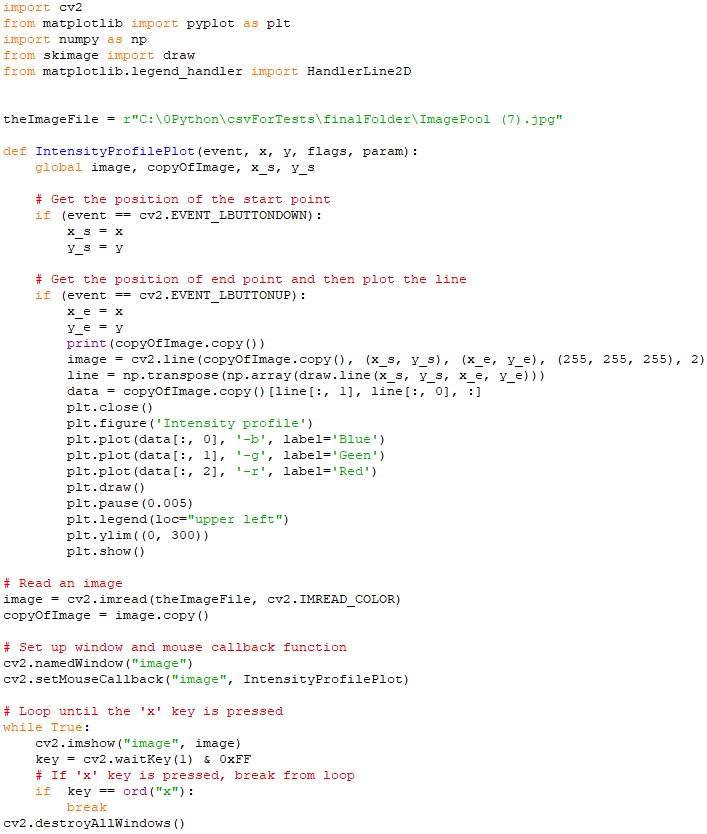
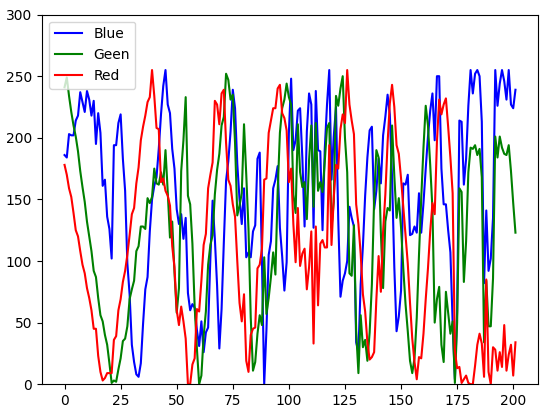
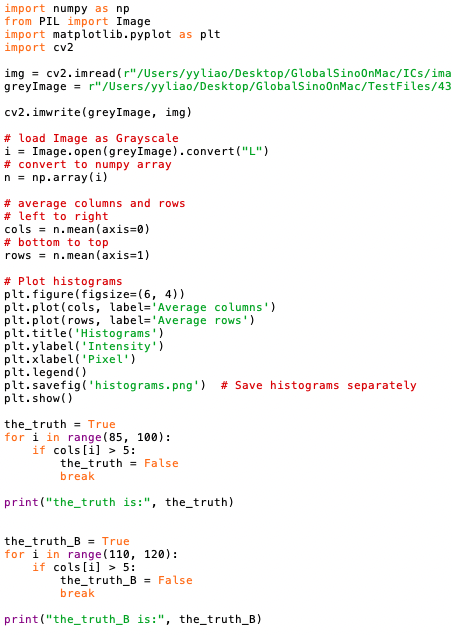
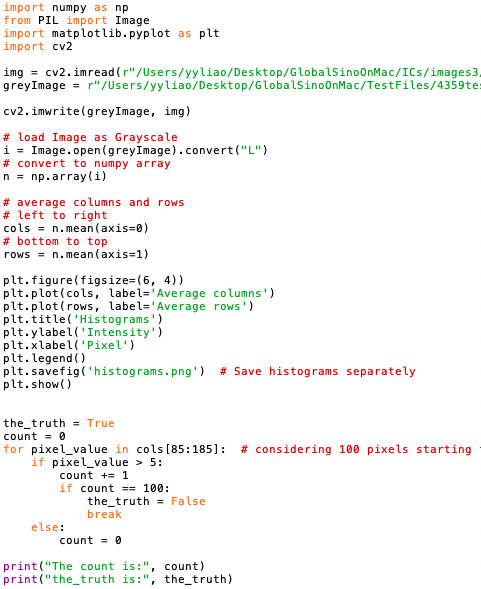
================================================================================= ============================================ Plot pixel intensities along a line of an image: code: ============================================ Drag the mouse from a start point to an end point to plot the blue, green and red intensities along a line on an image (the process can be stopped by pressing letter "x"). code: ============================================ Plot pixel intensities along a line of an image and crop the image in x direction: code: ============================================ Plot pixel intensities along a line of an image and crop the image in y direction: code: ============================================ Find any bright contrast within a range of x-coordinates or y-coordinates in pixel. Code: Output:
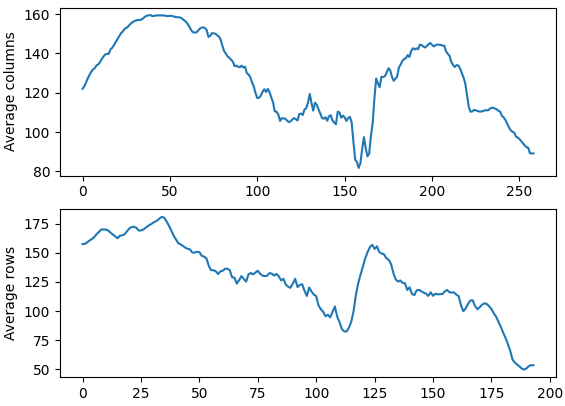
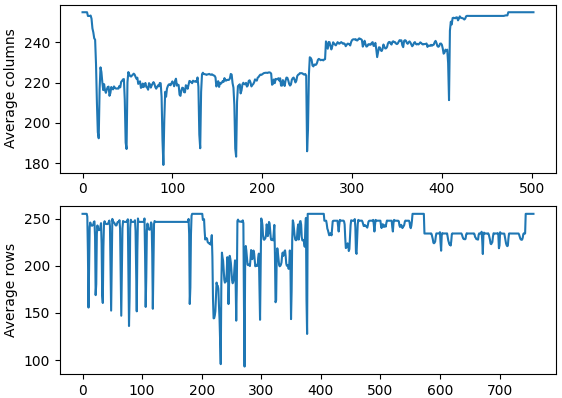
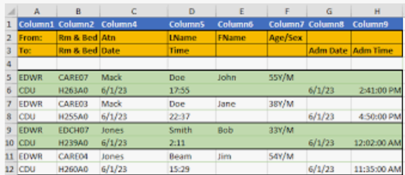
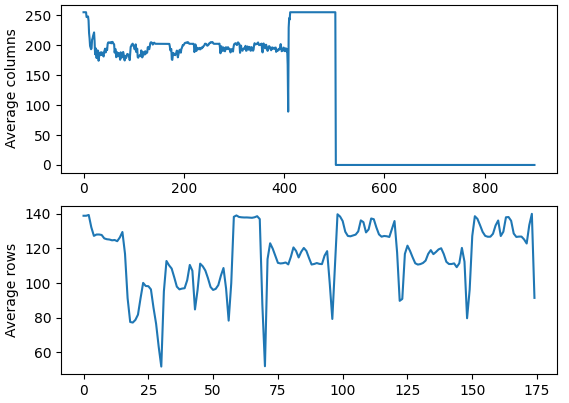
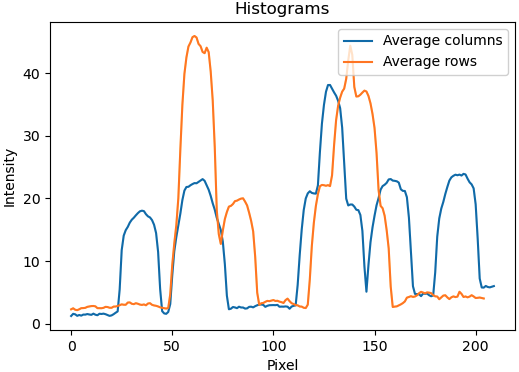
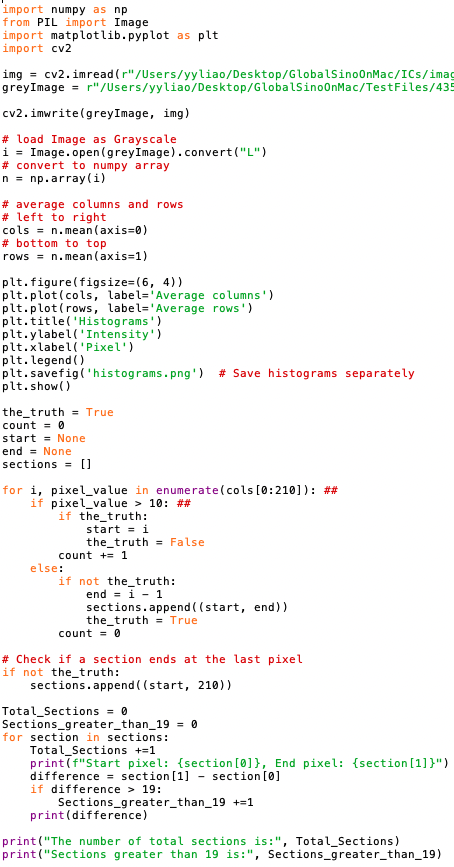
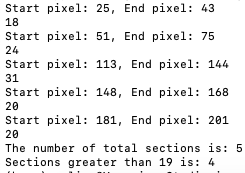
============================================ Analyzes a grayscale image, plots its column and row intensity histograms, and identifies continuous sections within a specific range of columns where the pixel values exceed a specific value, providing the start and end pixel indices for each identified section, and the number of sections which is wider than a specific pixel number. Code: Output: ============================================
|
||||||||
| ================================================================================= | ||||||||
|
|
||||||||


