Identification and Analysis of Shorting in ICs
- Integrated Circuits - - An Online Book - |
||||||||
| Integrated Circuits http://www.globalsino.com/ICs/ | ||||||||
| ================================================================================= | ||||||||
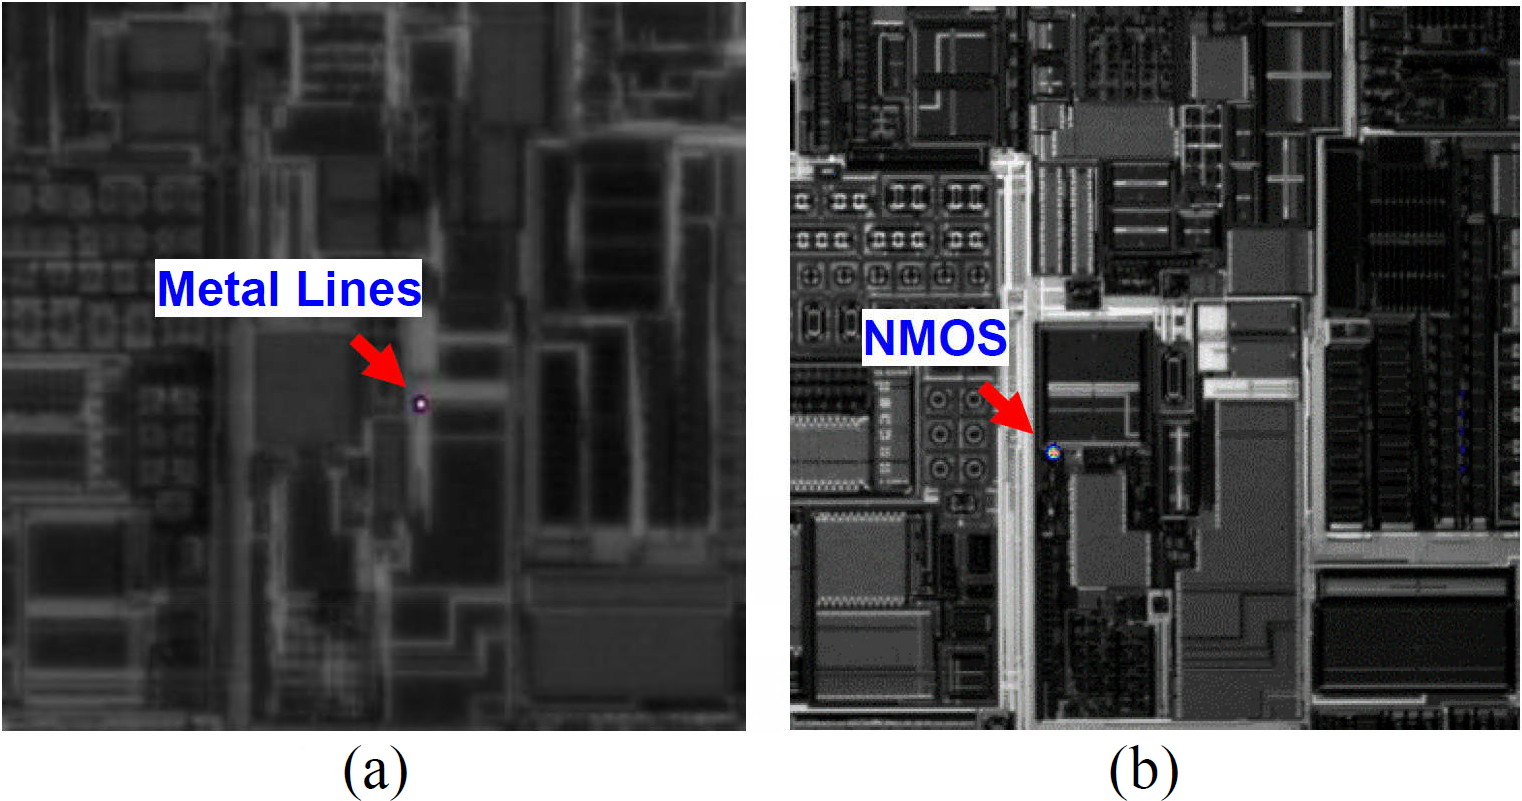
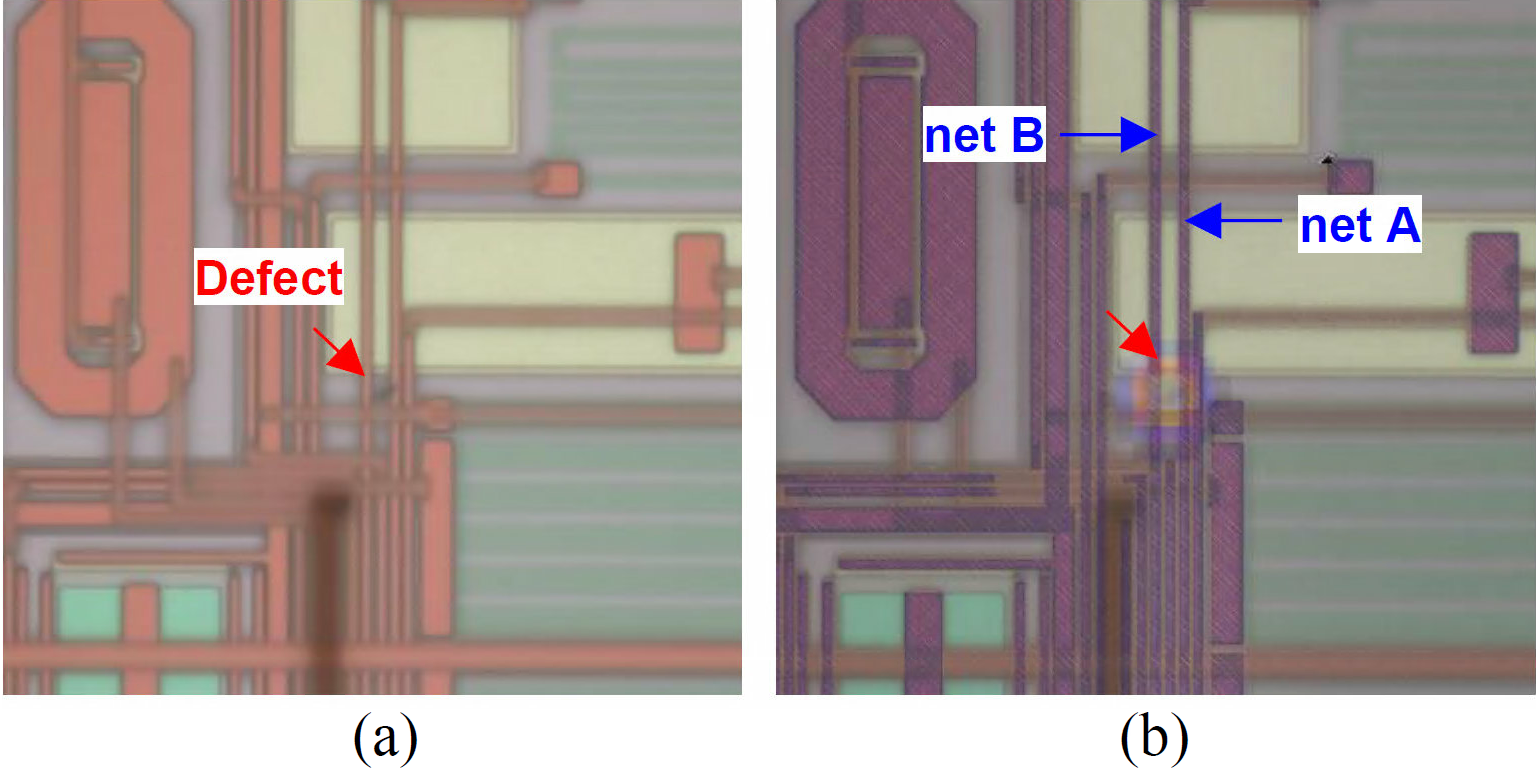
LIT was used to locate a fail in a 4-channel high brightness LED driver device, when there was an intermittent output switching signal. The fault isolation was done by powering up the unit using application specific evaluation kit with LIT imaging. This fail cannot be correctly located by PEM which indicated that the fail is at a NMOS device inside the same circuit block as shown in Figure 4912a. The fail observed by LIT had been verified by optical microscopy as shown in Figure 4912b, indicating shorting net A and net B, which was coincident to the hotspot observed during LIT fault isolation.
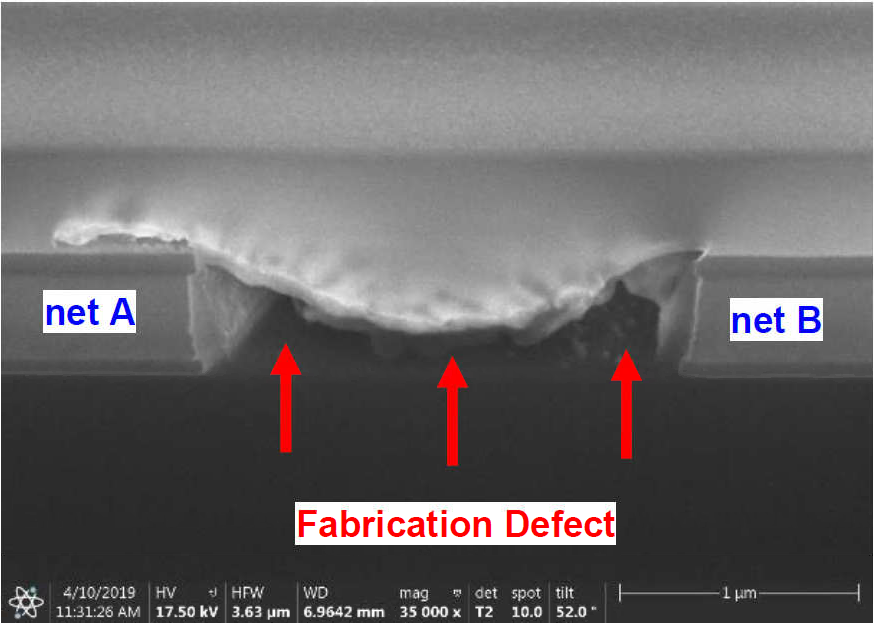
Figure 4912a. Images of the area on the chip: (a) LIT, and (b) PEM. [1] Figure 4912b. The observed defect: (a) optical and (b) superimposed LIT image. [1] Figure 4912c shows the Focused Ion Beam (FIB) cross-section image of the hotspot location with the defect, causing shorting between net A and net B.
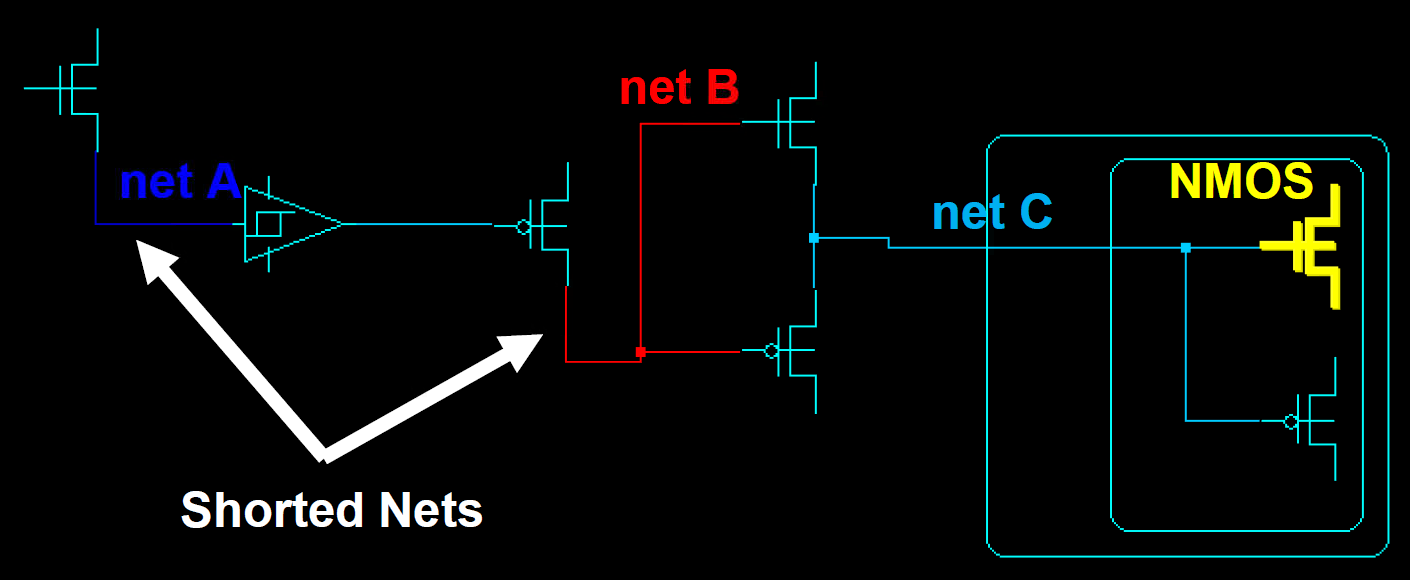
Figure 4912c. FIB cross-section image showing the defect, which caused the shorting. [1] The simplified schematic of the electrical circuit, in Figure 4912d, showed that the hotspot signal from the NMOS transistor, detected by PEM, was just a secondary effect of the real shorting between net A and net B.
Figure 4912d. Simplified schematic of the electrical circuit. [1]
[1] Paul Hubert P. Llamera and Camille Joyce G. Garcia-Awitan, Thermal Failure Analysis of Functional Failures by IR Lock-in Thermal Emission, ISTFA™ 2019: Conference Proceedings from the 45th, (2019).
|
||||||||
| ================================================================================= | ||||||||
|
|
||||||||