=================================================================================
The unavoidable delocalization of EELS signals practically limits the success of using EELS for chemical detection with atomic resolution. For instance, Figure 2229 (a) shows a HAADF-STEM image of single-layered h-BN (hexagonal boron-nitride) and Figure 2229 (b) is a corresponding atomic model where a EELS linescan has been recorded, shown in (c) and (d). The STEM contrast of the N and B locations is determined by the atomic number, called Z-contrast. Figure 2229 (c) and (d) shows the EELS profiles of the boron K-edge and nitrogen K-edge signals, respectively. The N K-edge intensity does not go down to zero even between two nitrogen atoms because of EELS signal delocalization [1]. The large probe tail and mechanical instabilities such as the specimen drift during the line scan may also partially contribute to the nonzero intensity but this should not be a dominant effect because the simultaneously recorded STEM profile clearly shows well-separated atoms similar to the STEM signal presented in Figure 2229 (a).
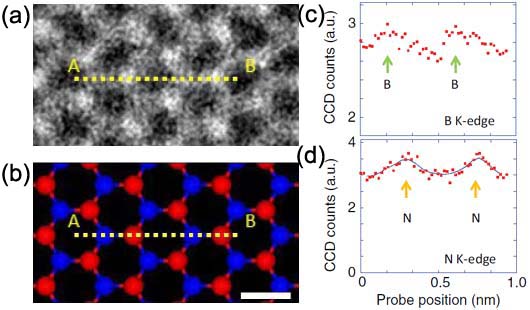
Figure 2229. (a) A HAADF-STEM image of single-layered h-BN (hexagonal boron-nitride), (b) A corresponding atomic model where an EELS linescan was recorded (red: nitrogen, blue: boron), and (c) and (d) the EELS profiles of the boron K-edge and nitrogen K-edge signals. Adapted from [2]
In Figure 2229 (c) and (d), the boron EELS maxima are less visible in comparison with the nitrogen profile so that it is more difficult to see the atomic maxima in the boron K-edge profile rather than in the nitrogen case. This difference can be interpreted by the energy-loss dependence of EELS signal delocalization, theoretically given by,
b = hν/ΔE --------------------------- [2229]
where,
b -- The impact parameter;
ν -- The speed of incident electrons;
h -- The Plank constant;
ΔE -- The energy loss.
Therefore, the delocalizations for the boron K edge and for the nitrogen K-edge are 0.15 and 0.08 nm, respectively.
Plasmon consists of longitudinal wave-like oscillations of weakly bonded electrons. The oscillations are rapidly damped with a typical lifetime of ~10-15 seconds and thus are localized to <10 nm.
Note that when both the illumination and EELS collection angles are small (e.g. in CTEM EELS), the EELS delocalization becomes large. [3,4]
[1] D. A. Muller and J. Silcox, Ultramicroscopy 59, 195 (1995).
[2] Kazu Suenaga, Haruka Kobayashi, and Masanori Koshino, Core-Level Spectroscopy of Point Defects in Single Layer h-BN, Physical Review Letters, 108, 075501 (2012).
[3] E.C. Cosgriff, M.P. Oxley, L.J. Allen, S.J. Pennycook, The spatial resolution of
imaging using core-loss spectroscopy in the scanning transmission electron
microscope. Ultramicroscopy 102, 317–326 (2005).
[4] R.F. Egerton, Limits to the spatial, energy andmomentum resolution of electron
energy-loss spectroscopy. Ultramicroscopy 107, 575–586 (2006).
|