=================================================================================
Table 2639. EELS edges
of argon (Ar).
| Lines |
Edges |
Routine measurement |
| M2,3 |
12 eV |
|
| M1 |
25 eV |
|
| L2,3 |
245 eV |
Used often |
| L1 |
320 eV |
| K |
3,203 eV |
|
TEM samples are normally milled by means of Ar+ ions during the stage of final thinning or cleaning of their preparation. Therefore,
L2,3-edge of Ar is often detected in EELS measurement in ion milled samples since some Ar atoms may remain in the finished sample, depending on the intensity and the duration of the etching, and especially when high angle milling is used.
For instance, Figure 2639 shows two EEL spectra taken from a Ar-contaminated NbOx layer and a pure NbOx layer. The TEM sample with a Ar-contaminated NbOx layer is prepared by Ar+milling. An argon reference EEL spectrum is also shown. The experimental spectra are presented after background subtraction under the Nb-M4,5 edges and correction for multiple scattering.
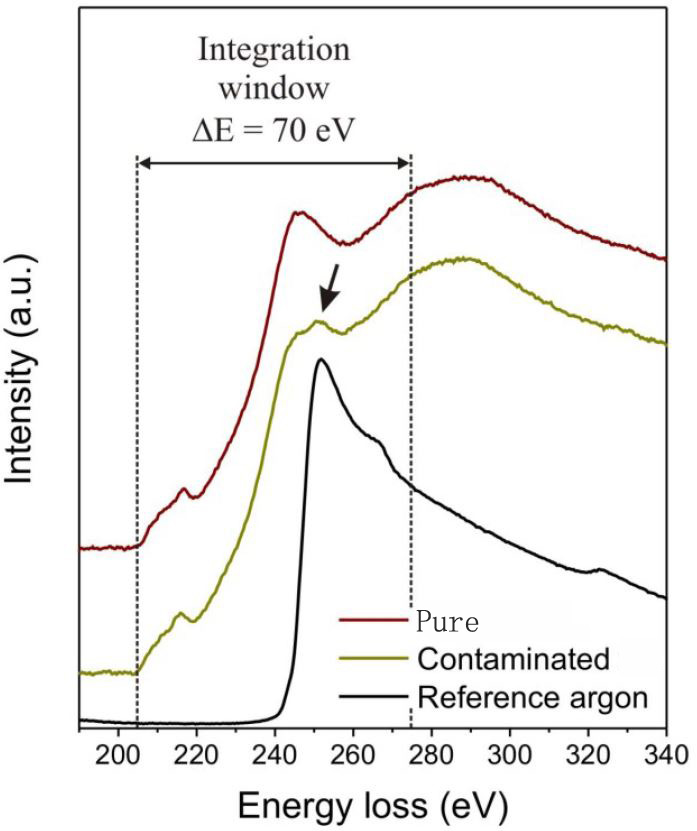
| Figure 2639. Two EEL spectra taken from a Ar-contaminated NbOx layer and a pure NbOx layer (x = 1~2.5) in two different TEM samples, argon reference EEL spectrum. The black arrow points to the Ar EELS peak, which is superimposed on the Nb-M4,5 edges. Adapted from [1] |
[1] David Bach, EELS investigations of stoichiometric niobium oxides and niobium-based capacitors, PhD thesis, 2009.
|