Ratio of the L3 to L2 White-line Intensity for 3d/4d Elements
- Practical Electron Microscopy and Database -
- An Online Book -
Electron microscopy
  Microanalysis | EM Book                                                                   https://www.globalsino.com/EM/  


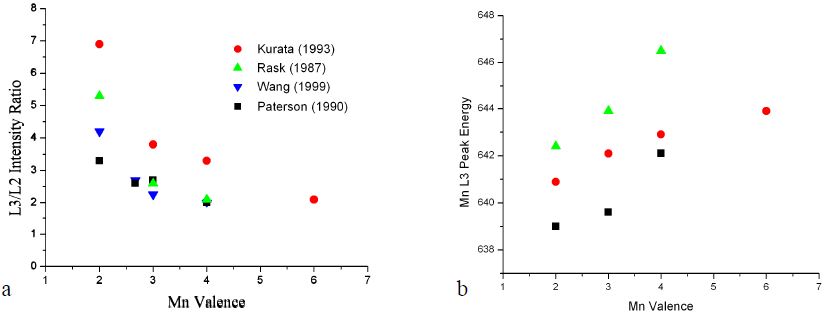
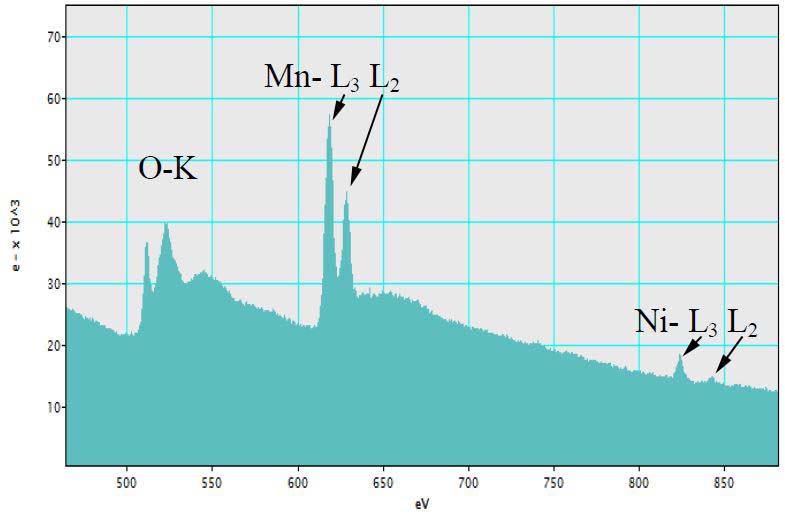
The two strong L3 and L2 white lines originate from the transition of electrons from the spin-orbit split levels 2p3/2 and 2p1/2 to unoccupied 3d states. The ratio of the L3 to L2 white-line intensity across the 3d series is theoretically expected to be 2:1 due to the statistical ratio of the initial states (four 2p3/2 electrons and two 2p1/2 electrons). In practice this ratio varies with atomic number (or d band occupancy) from 1:1 to about 4:1 [1]. In fact, the ratio and energy position of the L3 and L2 lines are significantly dependent on the d-band occupancy and thus on valence state of the transition element [2, 3].

Cosandey [4] summarized the previous investigations on manganese oxides in various valence states as shown in Figure 3374a [5-8]. All the four studies show that the L3/L2 (Similar to the L3 and L2 peaks in Figure 3374b) intensity ratios from Mn EELS measurements increase as the Mn valence state decreases. However, some variation exists among the studies due to the differences of the energy resolutions of particular EELS systems and of the methods used to extract the ratios. Therefore, for quantitative analysis, those potential instabilities need to be taken into account when we compare the results obtained from lab to lab.

(a) Mn L3/L2 intesity ratio and (b) Mn L3 peak energy as a function of Mn valence state

Figure 3374a. (a) Mn L3/L2 intesity ratio and (b) Mn L3 peak energy as a function of Mn valence state. [4]

EELS spectrum of LiMn1.5Ni0.5O4 electrode material

Figure 3374b. EELS spectrum of LiMn1.5Ni0.5O4 electrode material. [4] The Mn L3 and L2 peaks are clearly presented.


[1] R. D. Leapman and L. A. Grunes, Phys. Rev. Lett. 45, 497 (1980).
[2] Leapman RD, Grunes La, Fejes PL, Study of the L23 edges in the 3d transition metals and their oxides by electron-energy-loss spectroscopy with comparisons to theory, Physical Review B, 1982; 26 (1): 614-635.
[3] Botton GA, Appel CC, Horsewell A, Stobbs WM, Quantification of the EELS near-edge structure to study Mn doping in oxides, J. of Microscopy, 1995; 180: 211-216.
[4] F. Cosandey, Analysis of Li-Ion Battery Materials by Electron Energy Loss Spectroscopy, Microscopy: Science, Technology, Applications and Education, A. Méndez-Vilas and J. Díaz (Eds.), 1662, (2010).
[5] Kurata H, Colliex C, Electron-energy-loss core-edge structure in manganese oxide, Physical Review B, 1993; 48 (4): 2102-2108.
[6] Rask JH, Miner BA, Determination of manganese oxidation states in solids by electron energy-loss spectroscopy,
Ultramicroscopy, 1987; 21: 321-326.
[7] Wang Zl, Bentley J, Evans ND, Mapping the valence state of transition-metal elements using energy-filtered transmission electron microscopy, J. Phys. Chem. 1999; 103: 751-753.
[8] Paterson JH, Krivanek OL, ELNES of 3d transition-metal oxides II. Variations with oxidation state and crystal structure, Ultramicrosocpy, 1990; 32: 319-325.


;