=================================================================================
Figure 3407a shows the EELS profile of Ca in mineral gaudefroyite (Ca4Mn3+2.5(BO3)3(CO3)O2.25(OH)0.75) exhibits two intense white-line features because of the Ca L2,3 core-loss edge, arising from transitions from the 2p core level. The EXELFS (extended energy loss fine structure) modulations are very weak and is only visible on the tail of the edge.
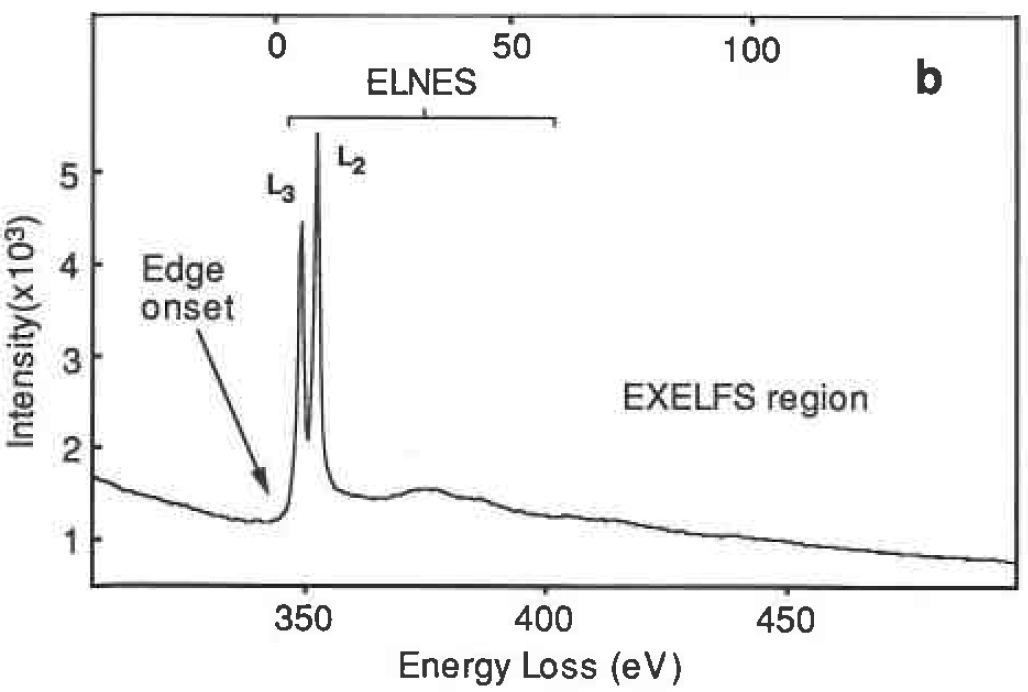
Figure 3407a. EELS profile of the Ca L2,3 core-loss edge, arising from
Ca elements in mineral gaudefroyite (Ca4Mn3+2.5(BO3)3(CO3)O2.25(OH)0.75). |
EEL spectrum shown in Figure 3407b was obtained from BN nanotubes prepared by continuous laser ablation of BN targets. It presents
five different edges, including B, C, Ca, N and O.
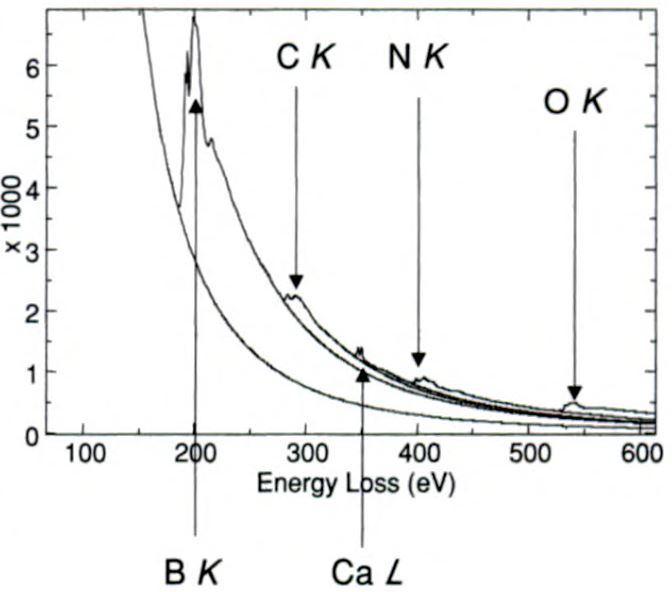
| Figure 3407b. EEL spectrum obtained from BN nanotubes prepared by continuous laser ablation of BN targets. [1] |
[1] Nan Yao, Zhong Lin Wang, Handbook of Microscopy for Nanotechnology, 2005.
|