Energy Loss Near Edge Structure (ELNES) - Practical Electron Microscopy and Database - - An Online Book - |
|||||
| Microanalysis | EM Book http://www.globalsino.com/EM/ | |||||
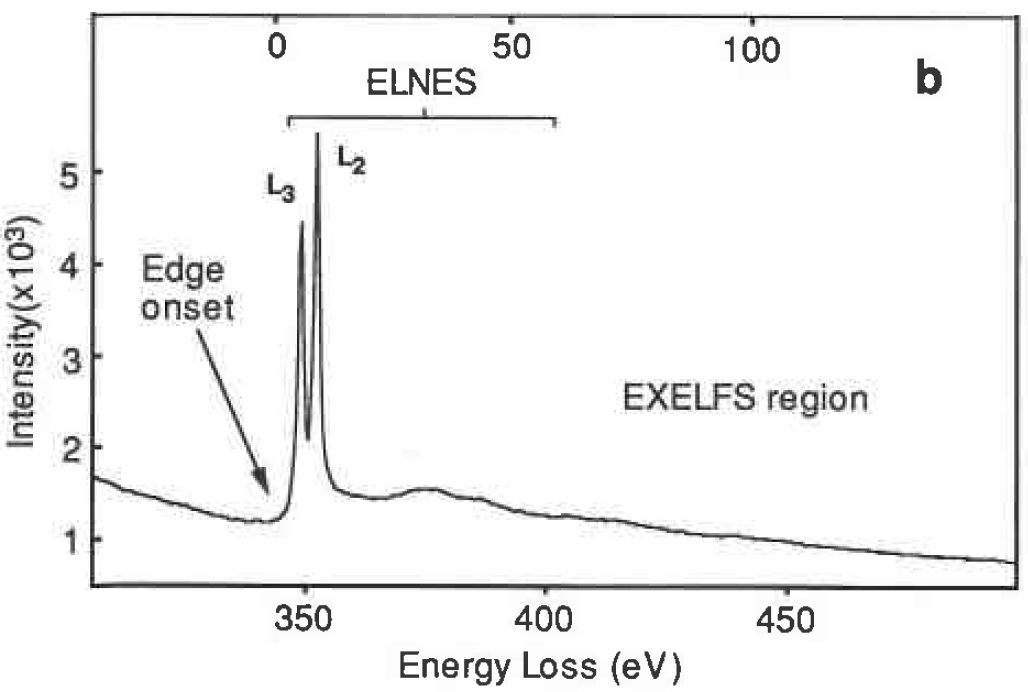
Both ELNES (energy loss near edge structure) and NEXAFS measure the electric dipole transitions from a selected core-orbital to unoccupied states. Due to the high energy resolution of EELS spectrometer, bonding information and site occupancy can be determined from analysis of near edge structure. However, although the fine structures of core loss spectra give information of the unoccupied density of states, the main application of EELS had still been the elemental quantification until the end of the 1980s mainly because the lack of modeling methods of the ELNES spectra. ELNES analysis has now been commonly applied since theoretical ELNES calculations become easier. Besides the ionization edges there is a fine structure superposed on the edge and extending up to ~ 50 eV from the EELS edge onset, reflecting the density of unoccupied states in the conduction band and known as the ELNES. In other words, ELNES that arises from the energy distribution of the empty electronic states above the Fermi level can present information on the local coordination. As we mentioned that based on the atomic ionization edges EELS technique can be used to quantitatively evaluate the concentration of the elements in TEM specimens, while the ELNES method, a branch of EELS technique, can be used to detect the small fluctuation of the post-edge intensity and thus, can be used to determine the electronic structure in the materials. This electronic structure includes the conduction band density of states (DOS), valence, coordination of atoms, and site symmetry in the local atomic environment. However, due to the selection rule, the near edge structure is not able to show the full view of DOS. Figure 3802a shows the ELNES profile of Ca in mineral gaudefroyite (Ca4Mn3+2.5(BO3)3(CO3)O2.25(OH)0.75) exhibits two intense white-line features because of the Ca L2,3 core-loss edge, arising from transitions from the 2p core level. The EXELFS (extended energy loss fine structure) modulations are very weak and is only visible on the tail of the edge.
Figure 3802a. EELS profile of the Ca L2,3 core-loss edge, arising from
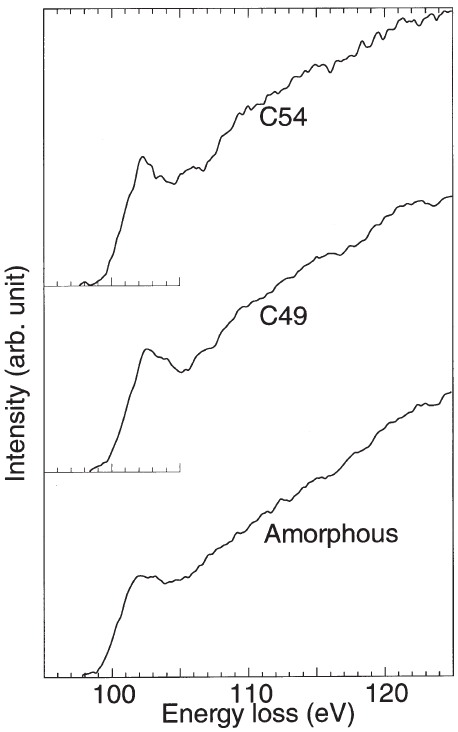
Ca elements in mineral gaudefroyite (Ca4Mn3+2.5(BO3)3(CO3)O2.25(OH)0.75). Figure 3802b shows experimental ELNES spectra at the Si-L2,3 edge taken from amorphous, C49, and C54 TiSi2. All the three spectra consist of a small peak located at around 102 eV superposed on a very broad peak. The clear difference between three spectra is the width of the first peak. This peak is sharper in the C54 sample than in the C49 sample, while the amorphous sample is similar to the C49 sample.
Figure 3802b. Experimental Si-L2,3 edge ELNES spectra taken from amorphous, C49, and C54 TiSi2.
[1]
A disadvantage of ELNES application is that there is no simple interpretation applicable to all edges in all materials, and calculation or modeling is sometimes required to understand the various features that are observed. [1] Mizoguchi T., Tanaka I., Mizuno M., Adachi H., Hashimoto T., Inui H., Yamaguchi M., Defect and electronic structure of TiSi2 thin films produced by co-sputterings. - Part II: Chemical bonding and electron energy-loss near-edge structures, Acta mater. 49 (2001) 2321–2328. |
|
||||

