=================================================================================
Comparing with the conventional electron diffraction methods such as selected-area electron diffraction (SAED) and nano-beam electron diffraction (NBED), precession electron diffraction (PED) technique has some advanced applications:
i) The intensity of PED is an integral of diffraction intensities over a large range of deviation parameter s and thus, the zone axis pattern (e.g. [u vw]) looks aligned well even though the crystal zone axis of the TEM sample is not exactly aligned with respect to the incident electron beam.
ii) The PED patterns not only display more diffraction spots in the zero-order Laue zone (ZOLZ) than SAED and NBED but also show some diffraction spots in the high-order Laue zones (HOLZ) which normally do not show in SAED and NBED patterns. PED also can show more diffraction spots than the conventional diffraction techniques. Therefore, PED is a very useful for the determination of the space groups of a crystal.
PED has made structure determination more efficient and powerful than conventional electron diffraction. In the PED case, dynamical effects and secondary scattering are reduced significantly, so that fewer reflections are excited simultaneously because the electron beam is always tilted away from zone axes.
Table 3905 summarizes the main comparison between conventional electron diffraction and precession electron diffraction.
| Table 3905. Main comparison between conventional electron diffraction and precession electron diffraction. |
| |
Conventional electron diffraction |
Precession electron diffraction |
| Dynamical effect |
|
Reduced significantly |
| Secondary scattering |
|
Reduced significantly |
| Reflection excitation |
|
Fewer reflections are excited simultaneously because the electron beam is always tilted away from zone axes |
| Intensities of reflections |
|
Much closer to those of the simulated
structure factors; extend to higher angle (see Figure 3905) |
| Structure determination |
Less efficient and powerful |
More efficient and powerful |
Figure 3905 shows the comparison between SAED and PED patterns of K2Nb14O36. The intensities on the PED pattern are much closer to those of the simulated structure factors compared to SAED pattern, especially for high-angle reflections. Reflections on the PED pattern also extend to higher angle.
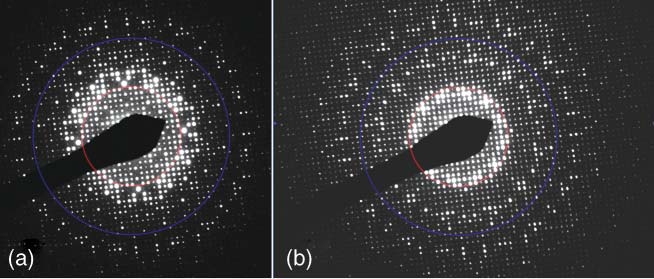
| Figure 3905. Comparison between SAED and PED patterns of K2Nb14O36. The red and blue circles
correspond to d-values of 3.0 Å and 1.5 Å, respectively. [1] |
[1] Junliang Sun and Xiaodong Zou, Structure determination of zeolites and ordered mesoporous materials by electron crystallography, DOI: 10.1039/c0dt00666a.
|