Pile-up Continuum in X-ray/EDS Profiles - Practical Electron Microscopy and Database - - An Online Book - |
|||||||||||||||||||||||||||||||||
| Microanalysis | EM Book http://www.globalsino.com/EM/ | |||||||||||||||||||||||||||||||||
| ================================================================================= | |||||||||||||||||||||||||||||||||
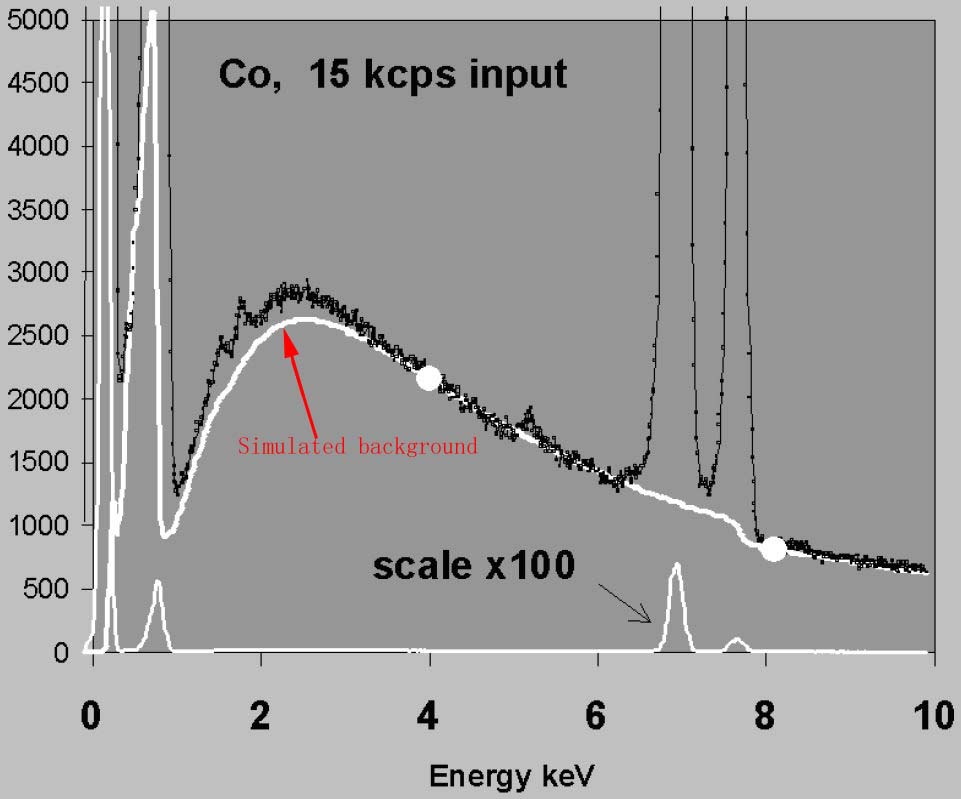
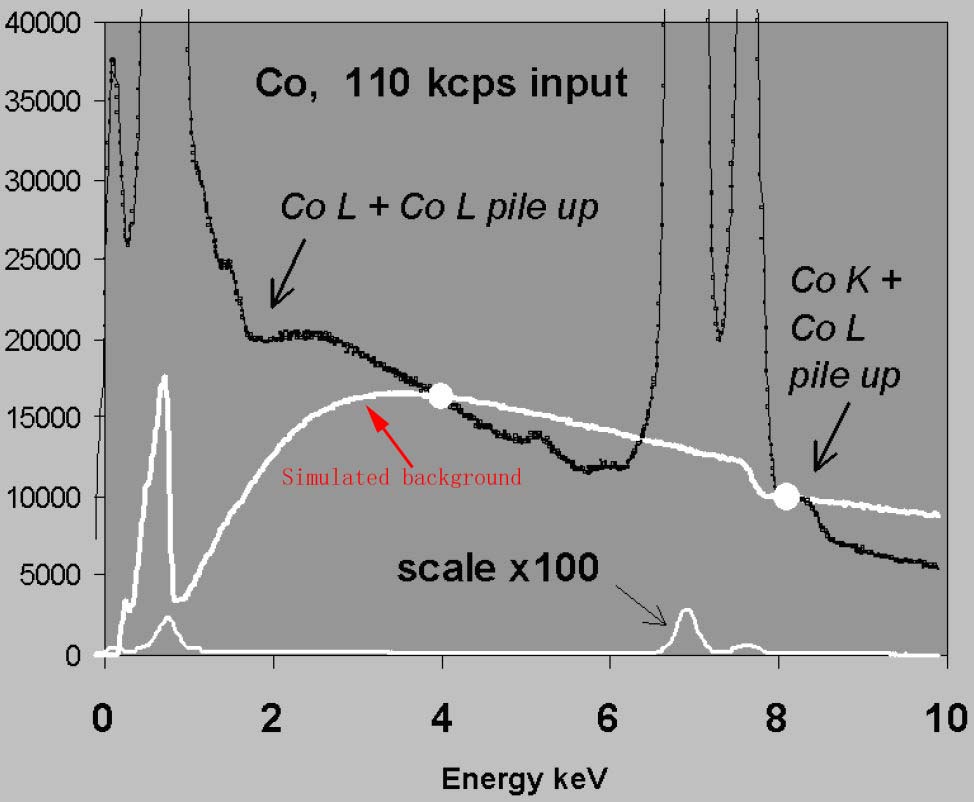
At high count rates, a pile-up continuum can appear in EDS spectra as a tail on the high energy side of peaks. [1] Figure 1238 employed the same theoretical background modeling program to subtract the EDS backgrounds. However, Figure 1238 (a) shows a good background fit to the spectrum taken at a modest count rate, while the spectrum taken at a high count rate shown in Figure 1238 (b) exhibits strong pile-up effects and thus, the background modeling provides a very poor background subtraction.
Table 1238. Pile up continuum and sum peaks.
[1] P. J. Statham, Pile-Up Rejection: Limitations and Corrections
for Residual Errors in Energy-dispersive Spectrometers, X-Ray
Spectrom. 6 (2), 94-103 (1977).
|
|||||||||||||||||||||||||||||||||
| ================================================================================= | |||||||||||||||||||||||||||||||||
|
|
|||||||||||||||||||||||||||||||||