=================================================================================
Table 2025a. Properties of aluminum (Al).
Resistivity (10-6 Ω•cm) |
2.66 |
|
Corrosion in air |
Good |
Melting point (°C) |
660 |
|
Specific heat capacity (Jkg-1K-1)
|
917 |
Thermal conductivity (Wcm-1) |
2.358 |
|
Heat conductivity (kh,Wcm-1K-1)
|
2.22 |
|
395
|
|
Vaporization heat (Qv, J-g-1) |
10470
|
Adhesion to SiO2 |
Good |
|
Vaporization temperature (Tv, °C) |
2450
|
Thermal stress per degree for
films on silicon (107 dyn cm-2 °C-1) |
2.1 |
|
Youngs modulus
(10-11 dyn cm-2) |
7.06 |
Coefficient of thermal expansion (CTE)
(10-6 °C-1) |
23.5 |
|
Work Function (eV) |
4.28 |
Electronegativity |
1.61 |
|
Absorption (1-R) |
0.10 for 1 µm light |
Density (g-cm-3) |
2.7 |
|
Lattice Constant (a, Å) |
4.048 ~ 4.050 |
Table 2025b. Lattice Spacing of aluminum (Al).
Miller Indices hk1 |
Lattice Spacing (d, Å) |
| 111 |
2.338 |
| 200 |
2.024 |
| 220 |
1.431 |
| 311 |
1.221 |
| 222 |
1.1690 |
| 400 |
1.0124 |
| 331 |
0.9289 |
| 420 |
0..9055 |
| 422 |
0.8266 |
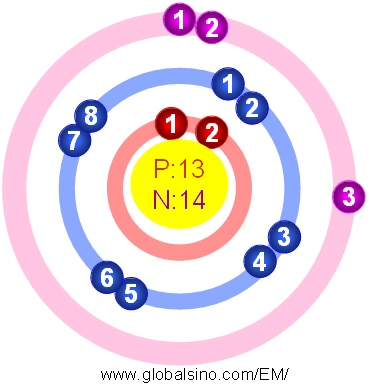
Figure 2025a shows the atomic structure of Al.

Figure 2025a. Atomic structure of Al.
The growth rate of pure aluminum (Al) bulk follows an empirical equation given by, [1]
 ------------------------------- [2025a] ------------------------------- [2025a]
where,
n -- The time exponent,
D -- The mean grain diameter,
t -- The time of annealing,
K -- The temperature-dependent constant given by,
 ------------------------------- [2025b] ------------------------------- [2025b]
where,
Q -- The activation energy for grain growth,
K0 -- A constant,
R -- The universal gas constant,
T -- The absolute temperature.
Table 2025c lists the different grain growth rates of pure bulk Al and Al-4% Cu alloy thin films after 100 min annealing. The grain growth rate increased by one order of magnitude in pure bulk Al, while in the same temperature range the growth rate only increased by a factor of about 0.8 in the Al-4% Cu alloy thin films. Moreover, the growth rates for pure Al are ~103 times greater than those for the Al-4% Cu alloy films.
Table 2025c. Grain growth rates of pure bulk Al and Al-4% Cu alloy thin films after 100 min annealing.
| Temperature (°C) |
Rate (Å/min) |
| Pure bulk Al [1] |
Al - 4% Cu films [2] |
| 400 |
1.0 × 10³ |
1.8 |
| 450 |
3.9 x 10³ |
2.4 |
| 500 |
1.3 × 10⁴ |
3.2 |
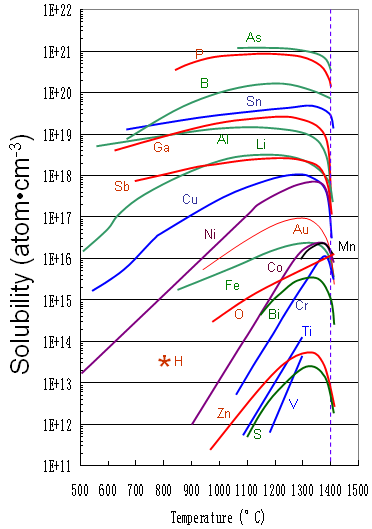
Figure 2025b shows the solid solubility of some impurities (including Al) in silicon.

Figure 2025b. Solid solubility of impurities in silicon.
As listed in Table 2025d, substances with large bonding energies usually have high melting temperatures.
Table 2025d. Bonding energies and melting temperatures of metallic substances.
Bonding type |
Substance |
Bonding energy |
Melting point (°C) |
| kJ/mol |
kcal/mol |
eV/Atom, Ion, or Molecule |
Metallic
|
Typical value |
50-1000 |
|
|
|
| Hg |
68 |
16 |
0.7 |
-39 |
| Al |
324 |
77 |
3.4 |
660 |
| Fe |
406 |
97 |
4.2 |
1538 |
| W |
849 |
203 |
8.8 |
3410 |
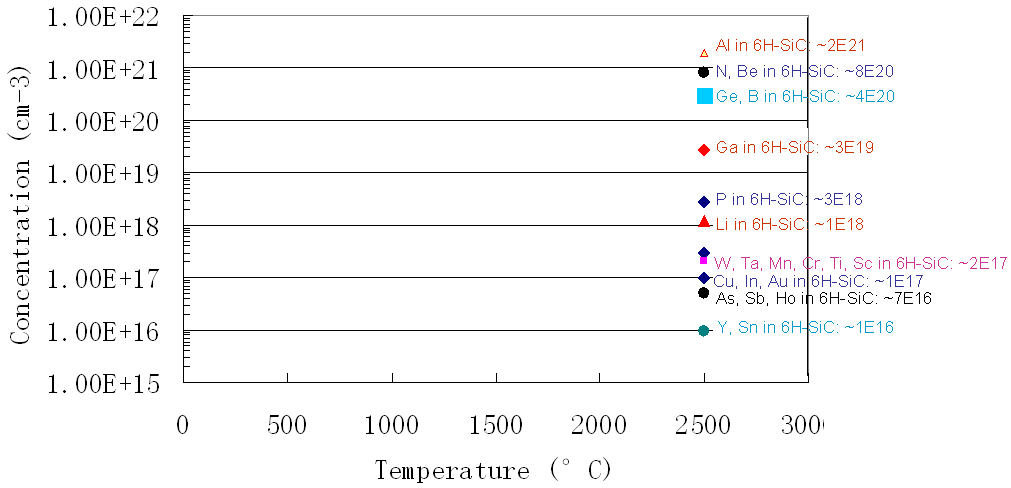
Figure 2025c shows the solubility for impurities (including Al) in SiC.

Figure 2025c. Solubility for impurities in SiC.
Table 2025e. Some aluminum-based alloys.
[1] P.A. Beck, L. T. Demer and M. L. Holzworth, Trans. Am. Inst. Min., Metall. Pet. Eng., 175
(1948) 372.
[2] William C. Mcbee, and John A. Mccomb, Grain Growth in Thin Aluminum-4% Copper Alloy Films, Thin Solid Films, 30 (1975) 137-143.
|