Chapter/Index: Introduction | A | B | C | D | E | F | G | H | I | J | K | L | M | N | O | P | Q | R | S | T | U | V | W | X | Y | Z | Appendix
| Time Domain Reflectometry (TDR) is a crucial measurement technique widely used in various industries for identifying faults in transmission lines and cables. The fundamental principle of TDR is to launch a controlled electrical stimulus into a medium, such as a transmission line, and measure the reflected signals that arise from impedance discontinuities. These reflections occur when the signal encounters changes in impedance, which may result from faults, mismatches, or structural irregularities within the medium. The time delay and characteristics of the reflected signals allow for precise diagnostics, including fault location and the nature of the discontinuities. TDR has become indispensable in fault isolation within semiconductor packaging, where it helps in identifying open and short circuits. TDR can effectively isolate package-level failures by transmitting a signal through the device under test (DUT) and comparing the resulting impedance load. For instance, in scenarios where an open failure occurs, the TDR signal reveals a high impedance after crossing critical interfaces such as the C4 bump, indicating a failure location in the die. [1] Figure 0774a (a) shows the failing TDR curve following the good curve up to the package substrate region, but then indicating high impedance after passing the C4 bump. This suggests an open failure located in the die. Figure 0774a (b) shows the DB-FIB (Dual Beam - Focused Ion Beam) cross-section that reveals melted metal layers (M8 to M9) beneath the failing bump location, further confirming the open failure at that specific site.
The time (x-axis) in Figure 0774a (a) in the TDR measurement is obtained by analyzing the travel time of the signal that is transmitted through the device under test (DUT) and reflected back due to impedance discontinuities:
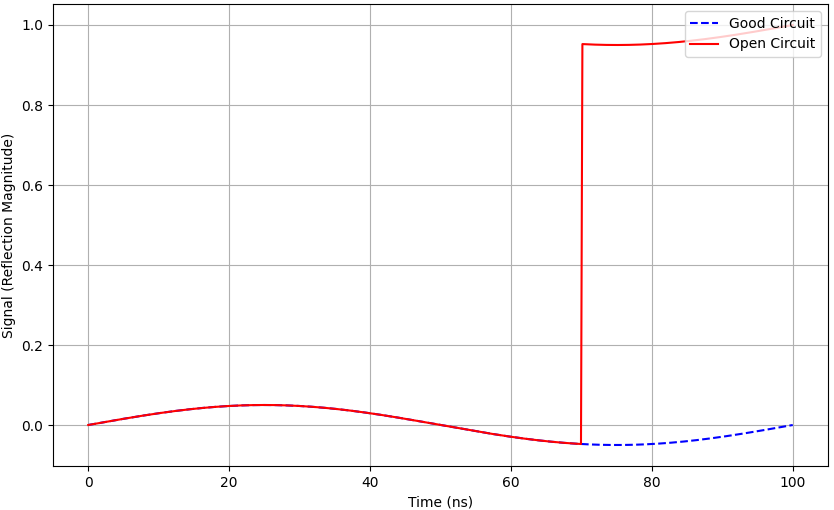
Figure 0774b illustrates the TDR signal for both a good circuit and an open circuit. The x-axis represents time (in nanoseconds), which correlates with the distance the signal has traveled before encountering any impedance discontinuity:
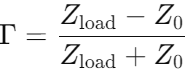
The magnitudes of pulse reflections in TDR measurements are determined by the reflection coefficient. The reflection coefficient () is defined as,
where,
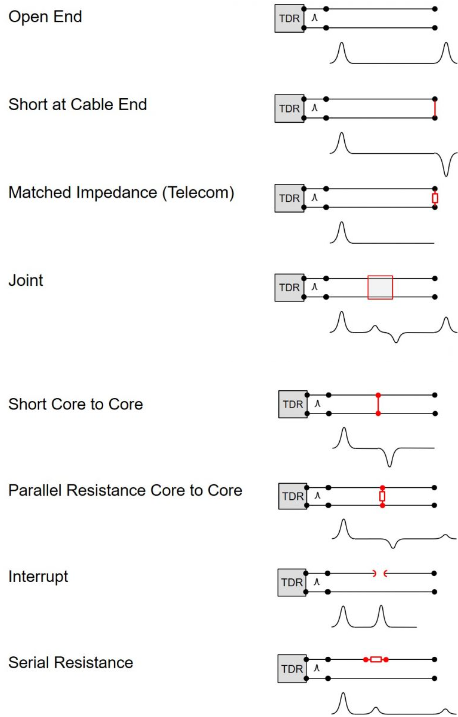
The reflection coefficient determines how much of the incident signal is reflected back when it encounters a change in impedance. If there is a perfect impedance match (Zload = Z0), no reflection occurs, and the reflection coefficient is zero. However, if there is an impedance mismatch (as in open or short circuits), a portion of the signal is reflected, and the reflection magnitude is proportional to the value of . For example:
Figure 0774c illustrates several common scenarios in TDR measurements and their respective signal reflections. Each scenario presents a different type of discontinuity or impedance mismatch in a transmission line or cable system. The TDR device sends an electrical pulse down the line, and the signal reflection patterns are recorded based on changes in impedance:
Classic TDR systems use an electrical pulse generator and oscilloscope to measure the reflected electrical signals as they travel through a transmission line or cable. The core mechanism is the reflection of an electrical pulse due to impedance discontinuities, not optical signals. However, in advanced variations of TDR, such as Electro-Optical Terahertz Pulsed Reflectometry (EOTPR), lasers can be included in the setup. Figure 0774d shows the basic setup for the TDR technique. It involves using TDR equipment to measure the continuity and discontinuity generated by the busbar connections in polycrystalline solar cells. This setup enables the identification of electrical signatures related to the busbar connection types, which helps in comparing ribbon versus wire busbar connections. The technique is used to detect faults in the modules between cell connections and assigns an electrical signature to each configuration, contributing to the improvement of the lamination process.
As technologies scale and become more complex, traditional TDR faces resolution limits, especially in packaging with 3D and through-silicon via (TSV) technologies. Innovations such as Electro Optical Terahertz Pulsed Reflectometry (EOTPR) have emerged, which provide sub-10 μm resolution, enabling more precise fault isolation in advanced packaging. [1] A significant application of TDR is its role in determining the location of cable faults and measuring the distance to those faults. This capability is particularly useful in large-scale installations such as telecommunications networks and industrial environments, where rapid fault identification is critical for minimizing downtime. Beyond cable diagnostics, TDR is employed for impedance mismatch measurements in transmission lines, including stripline and microstrip structures. These measurements help optimize system performance by reducing signal reflections and minimizing power loss, which is essential in high-frequency circuits and communication systems. TDR also aids in tuning filters and resonators, enabling engineers to fine-tune the resonant frequency and coupling apertures of various components in communication and signal processing systems. In these applications, TDR simplifies the tuning process by providing real-time feedback on the electrical characteristics of the system. Additionally, the use of gating techniques in TDR helps remove unwanted reflections or discontinuities that could otherwise complicate the analysis, improving the clarity and accuracy of the measurements. In modern electronics, TDR plays a vital role in signal integrity analysis, particularly in high-speed digital systems where maintaining signal quality is essential. TDR measurements are used to assess key signal integrity parameters, such as rise time, which indicates how quickly a signal transitions from low to high. Rise time is a critical metric for ensuring that high-speed digital circuits function correctly without introducing errors or signal distortion. TDR also helps address timing mismatches, known as intrapair and interpair skew, in differential signaling systems. These mismatches can cause significant performance degradation in high-speed data transmission, making TDR a valuable tool for fine-tuning and ensuring balanced line performance. Another critical application of TDR is in the analysis of crosstalk, which occurs when signals in adjacent lines interfere with each other. TDR is used to measure both near-end crosstalk (NEXT) and far-end crosstalk (FEXT), helping engineers identify sources of signal degradation and implement corrective measures to minimize interference. For advanced signal integrity applications, TDR is often coupled with eye diagram analysis, which provides a visual representation of signal quality by capturing metrics such as jitter, noise margins, and data integrity. Combining TDR data with eye diagram analysis allows engineers to gain a comprehensive understanding of system performance, enabling them to optimize the reliability of high-speed digital communication systems.
[1] Jiann Min Chin, Vinod Narang, Xiaole Zhao, Meng Yeow Tay, Angeline Phoa, Venkat Ravikumar, Lwin Hnin Ei, Soon Huat Lim, Chea Wei Teo, Syahirah Zulkifli, Mei Chyn Ong, Ming Chuan Tan, Fault isolation in semiconductor product, process, physical and package failure analysis: Importance and overview, Microelectronics Reliability 51, 1440–1448, 2011.
|


 --------------------------------------------------- [0774a]