Comparison between Infrared Spectrum and EELS - Practical Electron Microscopy and Database - - An Online Book - |
||||||||||
| Microanalysis | EM Book https://www.globalsino.com/EM/ | ||||||||||
| ================================================================================= | ||||||||||
Table 1221. Comparison between Infrared Spectroscopy and EELS.
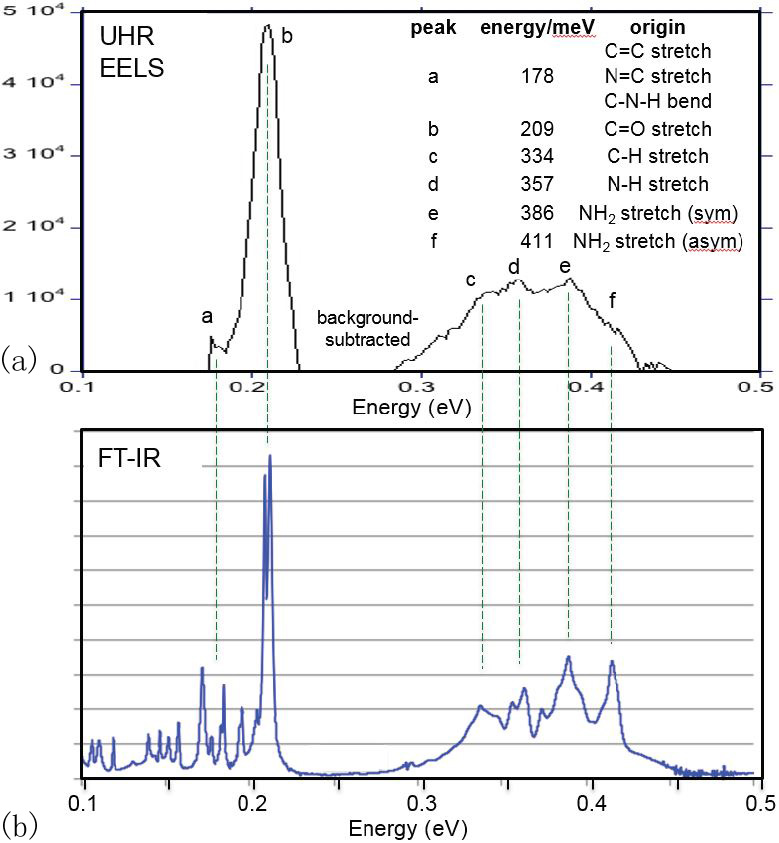
As an example, Figure 1221 shows an UHR EEL spectrum of guanine acquired at an accelerating voltage of 60 keV and an infrared spectrum of the same sample. The agreement between the results from the two techniques is very good, except EELS energy resolution is much worse.
[1] H. Cohen, P. Rez, T. Aoki, P.A. Crozier, N. Dellby, Z. Dellby, D. Gur, T.C. Lovejoy, K. March, M.C. Sarahan, S.G. Wolf and O. L. Krivanek, Hydrogen Analysis by Ultra-High Energy Resolution EELS, Microsc. Microanal. 21, 661, 2015.
|
||||||||||
| ================================================================================= | ||||||||||
|
|
||||||||||