=================================================================================
As shown in Figure 1926a, the caustic image in TEM is a disk with a bright spot. It is formed above the image plane when a convergent electron beam is focused at the object plane (sample plane) of the objective lens. The bright spot is the projection of the direct electron beam. The edge of the disk represents the caustic curve (the red circle in Figure 1926a).
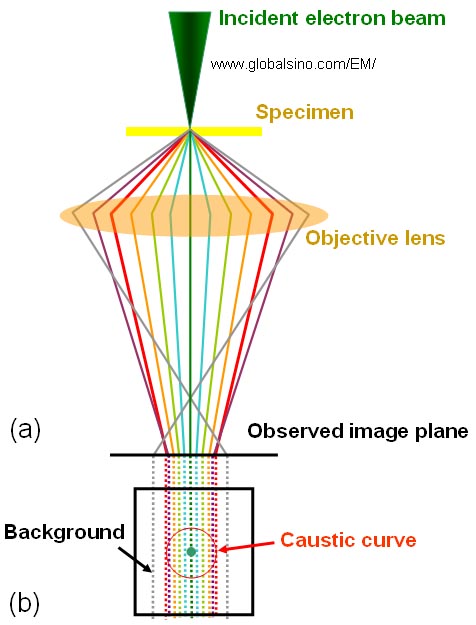
Figure 1926a. (a) The schematic illustration of the optical system and (b) The top-down projection of the formation of caustic image.
In TEM image mode, two main ways can be used to obtain a caustic curve:
i) Lower the sample height to below its optimal focus height (standard z-height) when a fine electron probe is focused onto the sample, keeping the objective lens current fixed. At a specific magnification, the size of caustic curve is determined by the height change.
ii) Defocus the objective lens when keeping the sample height fixed. At a specific magnification, the size of caustic curve is determined by the defocus value.
Depending on the height change or defocus value, the caustic curve may be cut off by the objective aperture if it is inserted.
Figure 1926b shows the optical schematics of defocused TEM and STEM. The aberrations in STEM mode can be detected and corrected using the symmetry in the Ronchigram that includes the azimuthal and the radial circles of infinite magnification [2]. The solid lines represent the electron scattering direction at the radial circle in STEM mode, corresponding to the caustic curve in TEM mode. The azimuthal circle (broken line) is related to the angle of focusing on the specimen, i.e. part of the highly scattered electrons, which cross the optical axis on the specimen.
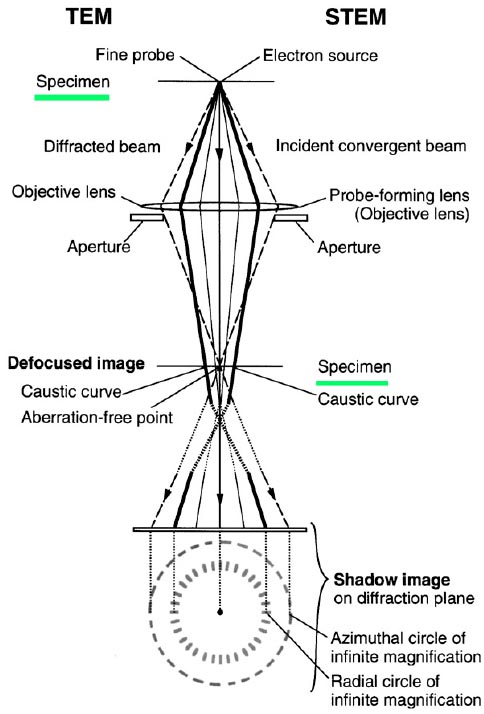
Figure 1926b. The optical schematics of defocused TEM and STEM. Adapted from [1]
Figure 1926c shows an underfocus TEM image of a (001) SrTiO3 crystal with an incident probe focused on the specimen. The caustic curve is also indicated in the figure.
High-angle thermal diffuse scattering is observed as Kikuchi bands, yielding background and a caustic curve.
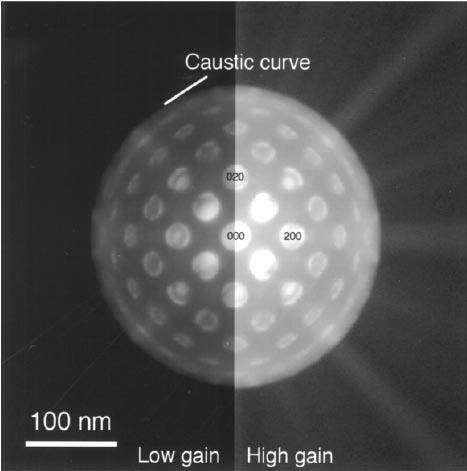
Figure 1926c. An underfocus TEM image of a (001) SrTiO3 crystal with an incident probe focused on the specimen.
Adapted from [1]
Although Figure 1926c appears to be convergent-beam electron diffraction patterns, it is TEM images at a magnification of 1E5 with a defocus of about +5 µm.
[1]
Koji Kimoto, Kazuo Ishizuka, Nobuo Tanaka, Yoshio Matsui, Practical procedure for coma-free alignment using
caustic figure, Ultramicroscopy 96 (2003) 219–227.
[2] N. Dellby, O.L. Krivanek, P.D. Nellist, P.E. Batson, A.R. Lupini, J. Electron Microsc. 50 (2001) 177.
|