=================================================================================
In EELS measurements, energy displacement is induced by the non-isochromaticity of the energy filter. Due to the non-isochromaticity of the energy filter the information from certain energy is not confined to an individual column or row on the CCD detector but gradually shifts from line to line, forming a characteristic aberration image. An image of the zero loss peak, recorded with the same energy slit, can be used to map the non-isochromaticity of the energy filter. This would give a very good approximation to the non-isochromaticity with a resolution depending on the energy slit width and the statistical quality of the zero loss peak. Provided that the same edge has the same energy, it is also possible to obtain the non-isochromaticity from the measured edge energy. Furthermore, this recorded aberration image based on the zero loss peak can be employed to compensate afterwards (off-line) by applying corresponding shifts to the spectra in each CCD line.
Figure 1938a shows the schematic illustration of laterally resolved EELS across the multi-layers in the specimen. The horizontal stripes in Figure 1938a (a) represent the multi-layers in the TEM specimen. Figures 1938a (b) and (c) shows the detectable shift in energy as a function of the vertical position on the CCD. At high dispersion (a low eV/channel value), the curvature of the zero loss (ZL) peak on the CCD indicates the non-isochromaticity of the filter, while at low dispersion the curvature of the ZL is hardly visible. Figure 1938b presents an example image about the non-isochromaticity of an energy filter shown in a CCD camera.
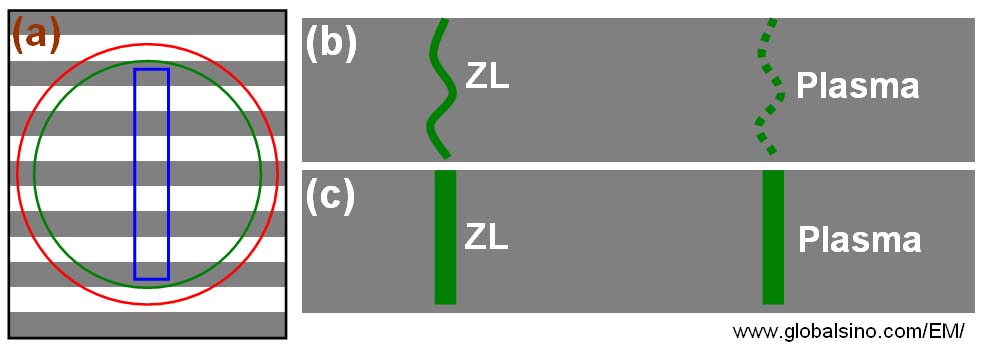
Figure 1938a. Schematic illustration of the laterally resolved EELS across the multi-layers in the specimen. (a) The slit aperture (in blue) across the interface of the multi-layers. The red (bigger) and green (smaller) circles represent the illumination area by the electron beam and the round spectrometer entrance aperture, respectively. (b) At high dispersion (a low eV/channel value), the curvature of the zero loss (ZL) peak on the CCD indicates the non-isochromaticity of the filter. (c) At low dispersion the curvature of the ZL is hardly visible.
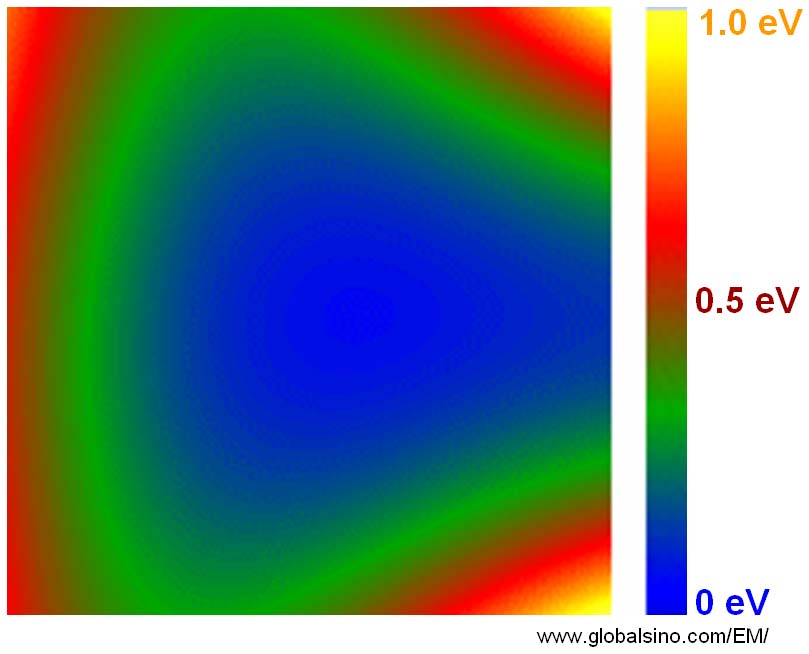
Figure 1938b. Example image about the non-isochromaticity of an energy filter shown in a CCD camera.
Table 1938a. Non-isochromaticity of some example energy filters.
| |
Model 966 GIF Quantum™
ERS 80 |
Model 966 GIF Quantum™
ERS 200 |
Model 966 GIF Quantum™
ERS 300 |
|
|
|
|
| Residual energy variation RMS (eV) |
0.38 |
0.50 |
0.69 |
|
|
|
|
| Non-isochromaticity max (eV) |
1.50 |
2.00 |
2.75 |
|
|
|
|
Table 1938b. Non-isochromaticity example before and after tuning a specific energy filter.
Non-isochromaticity of image (1st order):
        Initial: 1.76 eV
        Tune 1: 0.76 eV
        Final: 0.18 eV
Non-isochromaticity of image (2nd order):
        Initial: 1.78 eV
        Tune 1: 1.71 eV
        Final: 1.31 eV
|