Chapter/Index: Introduction | A | B | C | D | E | F | G | H | I | J | K | L | M | N | O | P | Q | R | S | T | U | V | W | X | Y | Z | Appendix
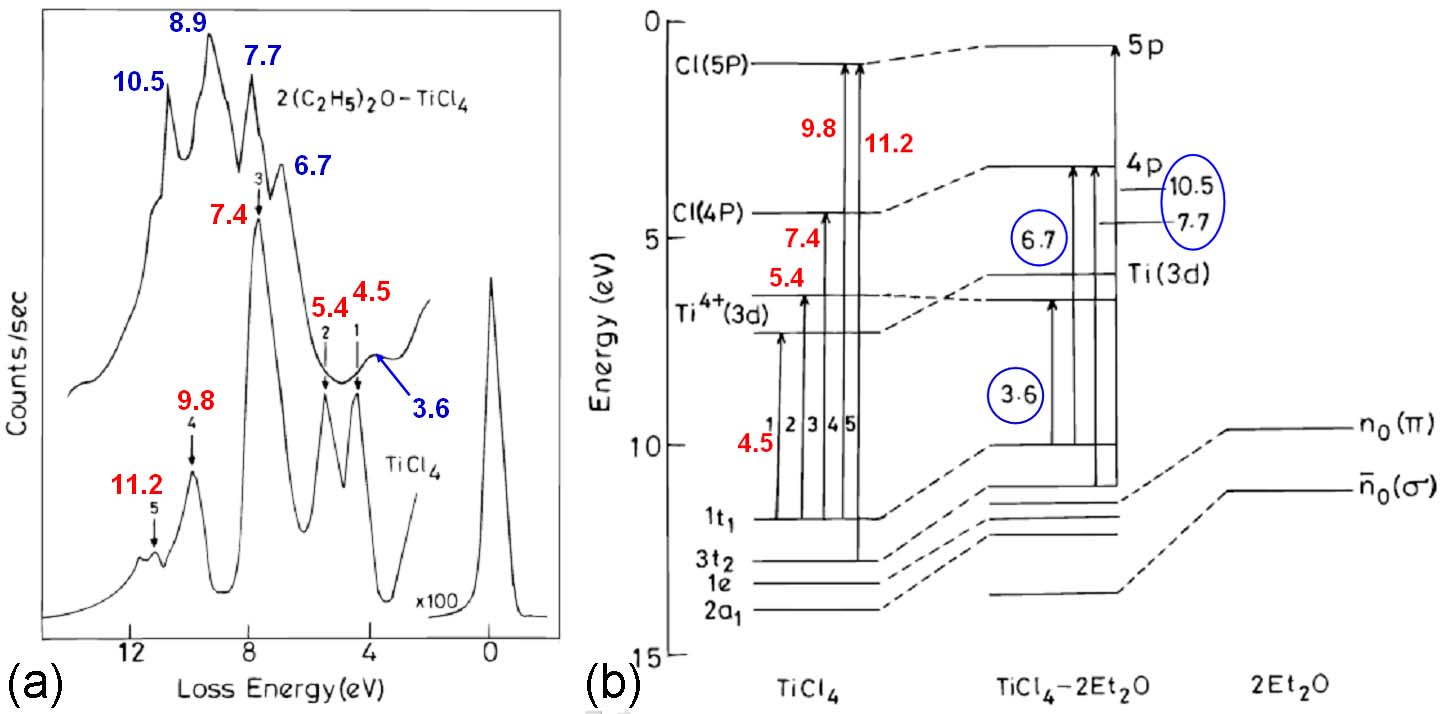
| Figure 2048a shows the EELS recorded with a home-built spectrometer [1], and the energy level diagram and electronic transitions of TiCl4 and TiCl4-2Et2O complex. For TiCl4, there are five prominent peaks 1 to 5 (in red). The first peak at 4.5 eV originates from the transition 1t1 to e, while the second one at 5.4 eV is due to the transition 1t1 to 1t2. The intense peak at 7.4 eV originates from the Rydberg transition 1t1 to 4P. The features at 9.8 and 11.2 eV originate from the transitions from the 1t1 and 3t2 orbitals to the Cl(5P) level. The spectrum of the TiCl4-2Et2O complex has the transitions at 3.6, 6.7, 7.7, 8.9, and 10.5 eV (in blue). The first peak at 3.6 eV originates from the charge transfer band due to the transition from the highest occupied shifted chlorine lone pair orbital to the Ti4+(3d). The peaks at 6.7 and 7.7 eV are from the transitions from the shifted 1t1 and 3t2 chlorine orbitals to the 4p Rydberg states. This shift is due to the complex formation. The peak at 10.5 eV originates from the 3t2 to 5p transition. Therefore, when the tetrahedral TiCl4 molecule is bonded to form octahedral TiCl4-2Et2O, the molecule should become more ionic. [2] The charge-transfer band in TiCl4 at 4.5 eV is shifted to 3.6 eV because of the change in the electronic structure of the molecule.
Figure 2048a. (a) The EELS, and (b) The energy level diagram and the electronic transitions of TiCl4 and TiCl4-2Et2O complex.
Adapted from [1]
Brown and Ho [3] used an EELS spectrometer with an incident electron energy of 10 eV, consisting of a double-pass cylindrical monochromator and single-pass cylindrical analyzer, to analyze the interaction between methyl chloride and Si( 100) 2 x 1. Figure 2048b shows the EEL spectra obtained after 1 L exposures of methyl chloride (CH3CI) onto the Si(100) surface held at 85 and 300 K. The origin of the peaks, related to the existence of molecularly adsorbed species, is listed in Table 2048.
Figure 2048b. The EEL spectra obtained after 1 L exposures of methyl chloride onto the Si(100) surface held at 85 and 300 K. [3] Table 2048. The origin of the peaks in Figure 2048b.
[1] S. P. Ananthavel and M. S. Hegde, Electron States of 1:2 Addition Compounds of TiCl4 with Diethyl Ether and Diethyl Sulfide: HeI Photoelectron and Electron Energy Loss Spectroscopy Studies, J. Phys. Chem. A 1997, 101, 1680-1683.
|