=================================================================================
Figure 2223a shows the Si-Ti phase diagram.
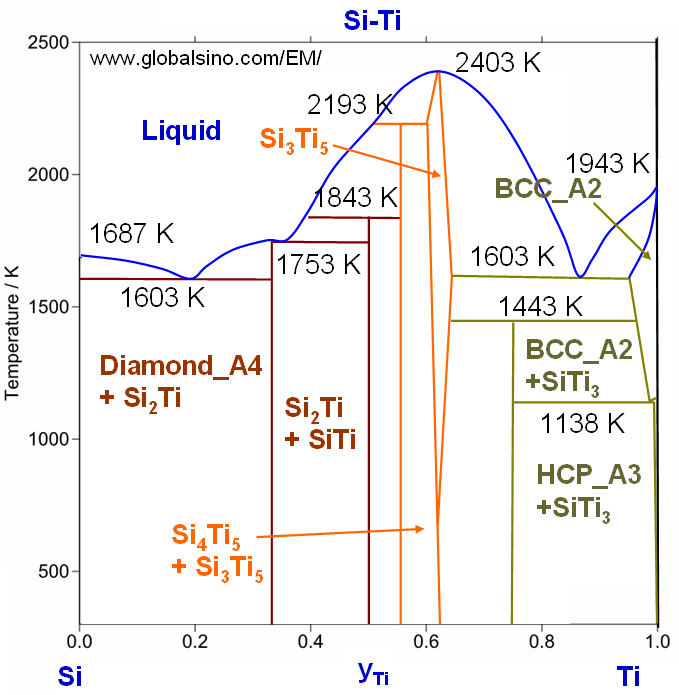
Figure 2223a. The Si-Ti phase diagram.
Figure 2223b shows the equilibrium Ti-N (titanium-nitrogen) phase diagram.
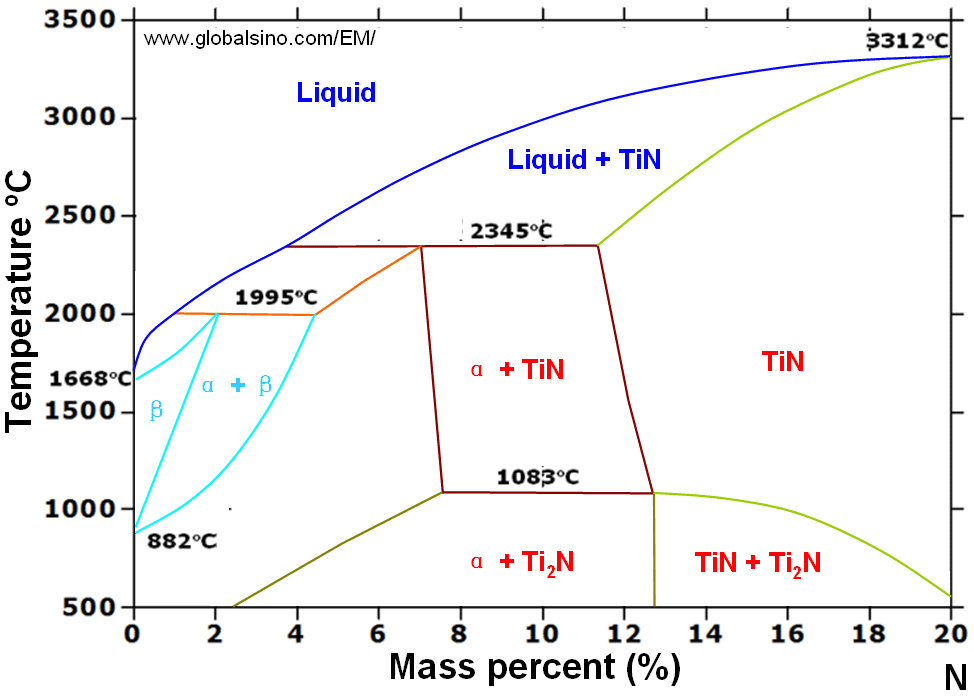
Figure 2223b. The equilibrium Ti-N (titanium-nitrogen) phase diagram.
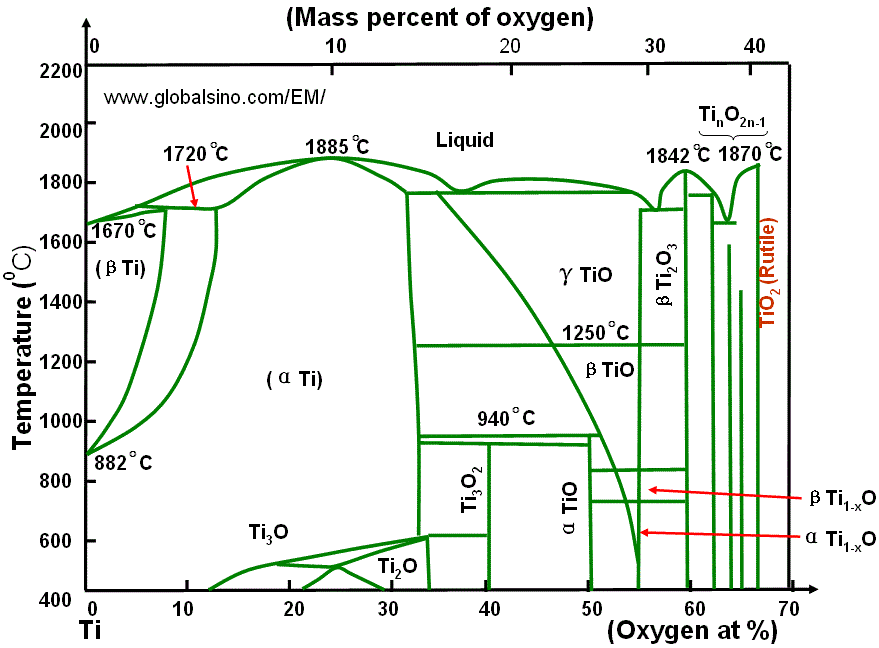
Figure 2223c. Ti-O phase diagram.
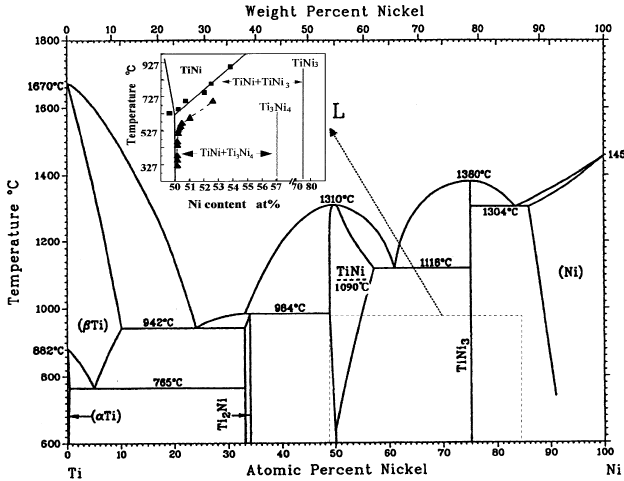
Figure 2223d. Ti-Ni phase diagram. [1-3]
[1] K. Otsuka, X. Ren, Physical metallurgy of Ti–Ni-based shape memory alloys, Progress inMaterials Science 50 (2005) 511–678.
[2] Massalski TB, Okamoto H, Subramanian PR, Kacprzak L, editors. Binary alloy phase diagrams,
2nd edition, vol. 3. Materials Park, OH: ASM International; 1990. p. 2874.
[3] Otsuka K, Kakeshita T. MRS Bulletin2002;27:91.
|