|
This book (Practical Electron Microscopy and Database) is a reference for TEM and SEM students, operators, engineers, technicians, managers, and researchers.
|
=================================================================================
The intensity of electron beams in EMs can normally be considered in Gaussian distribution with a probe tail. In most EM measurements, the effects of the probe tail are negligible. For instance, Figure 2230 (a) shows a HAADF-STEM image of single-layered h-BN (hexagonal boron-nitride) and Figure 2230 (b) is a corresponding atomic model where a EELS linescan has been recorded, shown in (c) and (d). The STEM contrast of the N and B locations is determined by the atomic number, called Z-contrast. Figure 2230 (c) and (d) shows the EELS profiles of the boron K-edge and nitrogen K-edge signals, respectively. The N K-edge intensity does not go down to zero even between two nitrogen atoms because of EELS signal delocalization [1]. The large probe tail and mechanical instabilities such as the specimen drift during the line scan may also partially contribute to the nonzero intensity but this should not be a dominant effect because the simultaneously recorded STEM profile clearly shows well-separated atoms similar to the STEM signal presented in Figure 2230 (a).
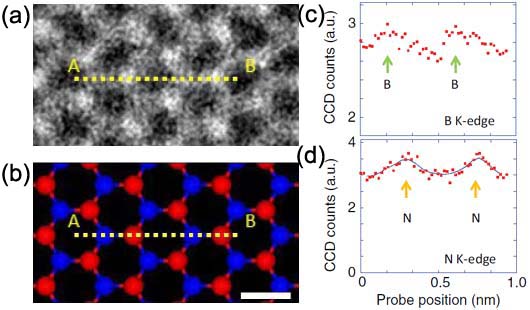
Figure 2230. (a) A HAADF-STEM image of single-layered h-BN (hexagonal boron-nitride), (b) A corresponding atomic model where a EELS linescan was recorded, and (c) and (d) the EELS profiles of the boron K-edge and nitrogen K-edge signals. Adapted from [2]
In the typical case with a Gaussian-function electron probe, 50% of the total beam current is contained within a disk with a diameter of the FWHM of the Gaussian profile and 90% of the total current is contained within the full width at tenth maximum (FWTM). Both widths are used as definitions of the probe size and spatial resolution; however, the former is normally quoted by EM manufacturers. Note if the spatial resolution is defined by FWTH, the spatial resolution for a TEM probe can be more than 40x the FWHM.
[1] D. A. Muller and J. Silcox, Ultramicroscopy 59, 195 (1995).
[2] Kazu Suenaga, Haruka Kobayashi, and Masanori Koshino, Core-Level Spectroscopy of Point Defects in Single Layer h-BN, Physical Review Letters, 108, 075501 (2012).
|