=================================================================================
The aberration measurements using Ronchigram in STEM are mainly based on focus change [6], autocorrelations from amorphous specimens [7], or Fourier transforms of crystalline specimens [8]. The accuracy of the latter two methods depends on the accuracy of the initial calibration of the defocus.
Lin et al. [1] proposed a method to determine the aberrations of probe-forming lenses by using several focal sets of the Ronchigram and Sawada et al. [2] applied a method called SRAM (segmental Ronchigram autocorrelation function matrix) to correct aberrations. A Ronchigram was also applied to calculate the aberration parameters, and was further used in the auto-tuning procedure of the probe-forming lens system by Krivanek et al. [3,4].
Sawada et al. [5] had used segmental Ronchigram autocorrelation function matrix (SRAM) method to measure the aberration coefficients before and after aberration corrections. Figure 2745 shows the central parts of the Ronchigram patterns in a focal series. The Ronchigrams from the amorphous film were divided into 7 × 7 segments in order to calculate the aberration coefficients (up to fifth-order) and to perform autocorrelation functions. The absolute values of each aberration coefficient were calibrated by referring to the difference between the defocus values of the two Ronchigrams [1]. Furthermore, the residual aberration can also be obtained by comparing the experimental and calculated simulations of Ronchigrams.
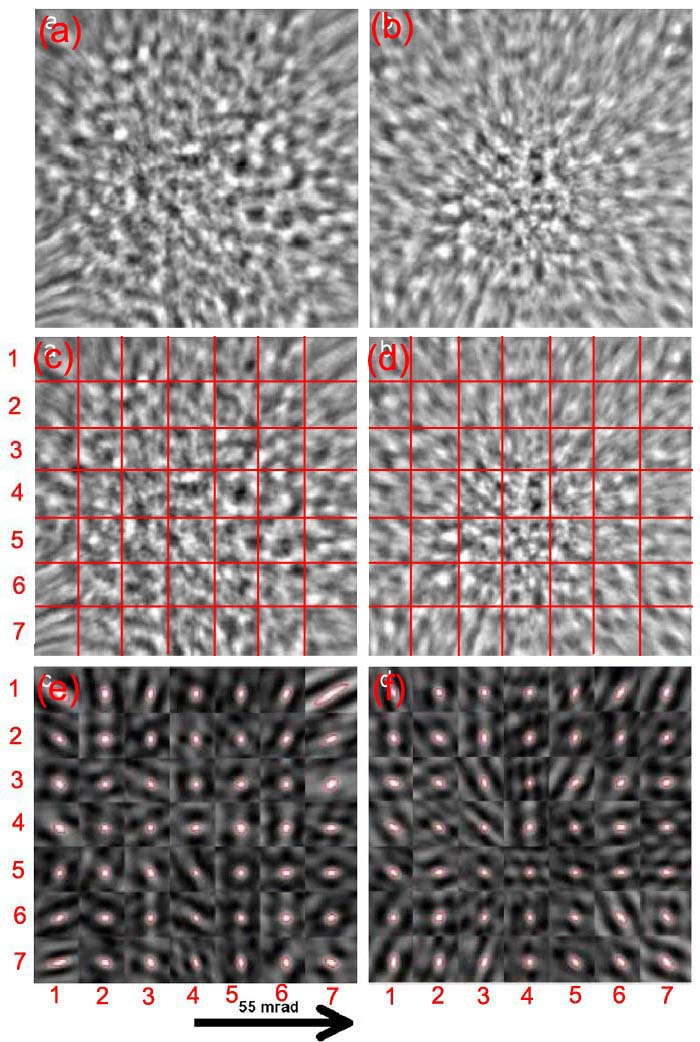
Figure 2745. The focal series of Ronchigrams: (a) Under-focus of 128 nm and (b) Over-focus of 128 nm. (c) and (d) Grided images of (a) and (b), respectively. (e) and (f) Autocorrelation functions from (a) and (b), respectively.
Adapted from [5]
[1] J. A. Lin, J. M. Cowley, Ultramicroscopy 19 (1986) 31.
[2] H. Sawada, T. Sannomiya, F. Hosokawa, T. Kaneyama, Y. Kondo, Y. Tanishiro,
K. Takayanagi, Proc. IMC 16 (2006) 632.
[3] O.L. Krivanek, N. Dellby, A.R. Lupini, Ultramicroscopy 78 (1999) 1.
[4] N. Dellby, O.L. Krivanek, P.D. Nellist, P.E. Batson, A.R. Lupini, J. Electron
Microsc. 50 (2001) 177.
[5] Sawada H, Sannomiya T, Hosokawa F, Nakamichi T, Kaneyama T,
Tomita T, Kondo Y, Tanaka T, Oshima Y, Tanishiro Y, and Takayanagi
K (2008) Measurement method of aberration from Ronchigram by
autocorrelation function. Ultramicroscopy 108: 1467–1475.
[6] Q. M. Ramasse, A. L. Bleloch, Ultramicroscopy 106 (2005) 37.
[7] H. Sawada, et al., Ultramicroscopy 108 (2008) 1467.
[8] A. R. Lupini, S. J. Pennycook, Journal of Electron Microscopy (Tokyo) 57 (2008)
195.
|