Peak(Signal)-to-Background (S/B) Ratio in EELS - Practical Electron Microscopy and Database - - An Online Book - |
|||||||||||||||||||||||||||||
| Microanalysis | EM Book http://www.globalsino.com/EM/ | |||||||||||||||||||||||||||||
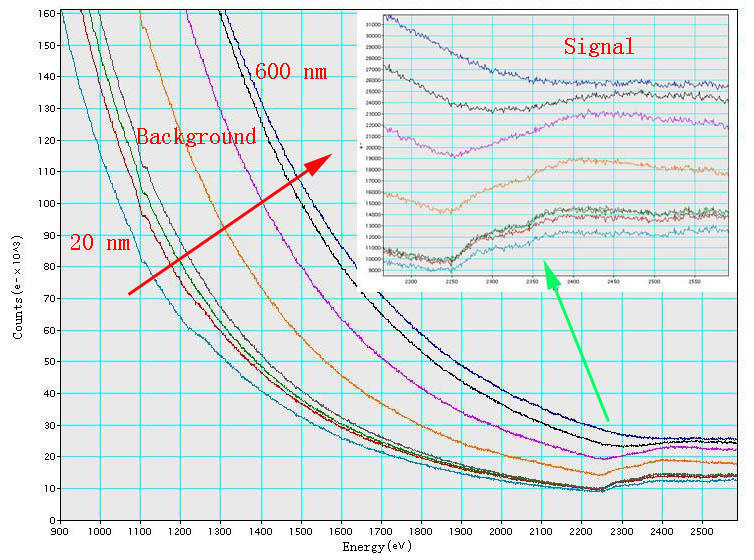
Similar to EDS spectra, the peak-to-background ratio (P/B ratio), or so-called signal-to-background ratio (S/B ratio), in EELS spectra increase with the accelerating voltages from 100 kV to 400 kV, resulting in an increase in the detection sensitivity of any trace elements. The P/B ratio in EELS also varies with specimen thickness. For instance, Figure 3413a shows that the background increases dramatically with increase of the thickness of TEM specimen, while the signal of Pt M4,5 edge decreases significantly. The highest signal in the range of these TEM specimen thicknesses for Pt occurs at 20 nm.
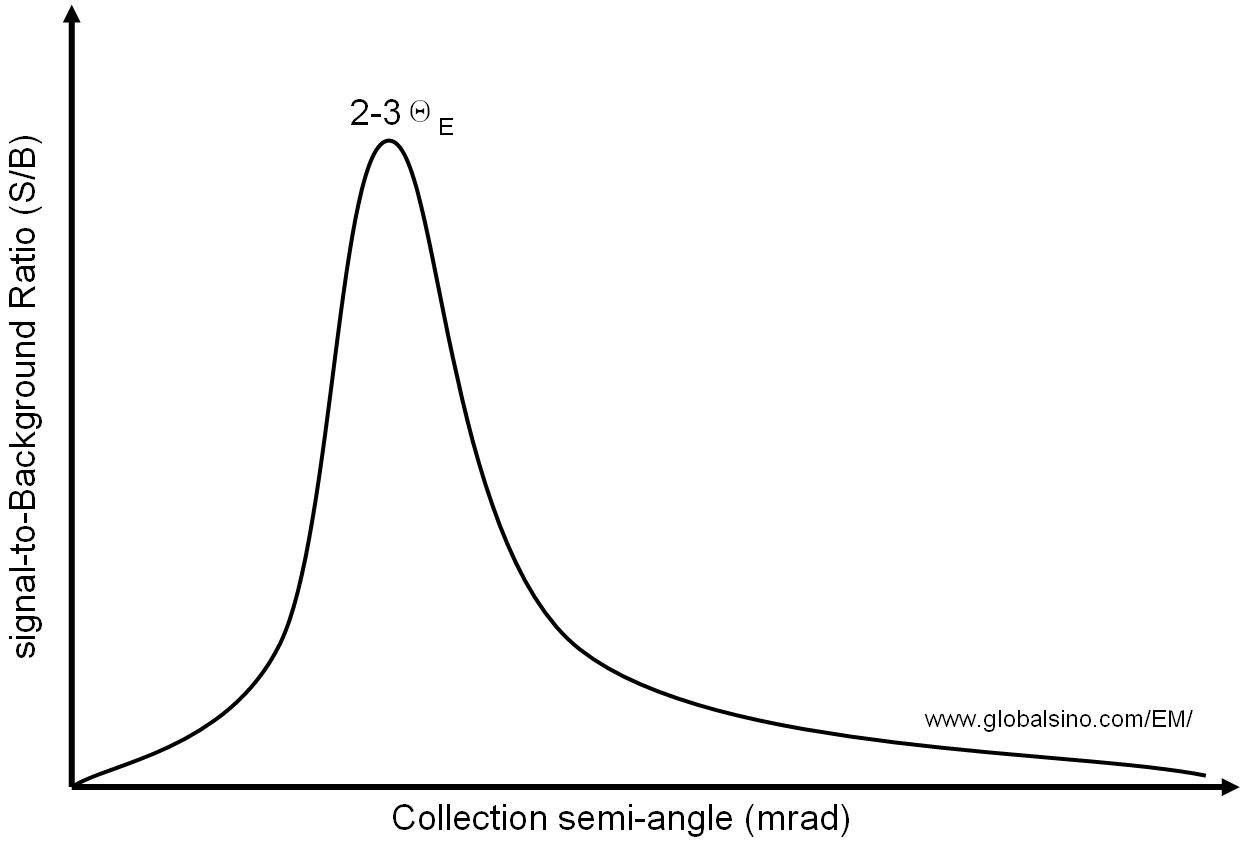
Figure 3413a. EELS of Pt M4,5 edge. On the other hand, as discussed on page2400, larger collection angles increase the background contribution quicker than the edge signal, resulting in a drop in the signal-to-background ratio as shown in Figure 3413b. Another consideration is that the magnitude of the entrance aperture is chosen as a compromise between maximizing both the signal-to-noise (SNR) and the signal-to-background ratio (SBR). In practice, a good compromise is to employ a collection angle of ~2-3ΘE. [1]
Table 3413. Examples of signal-to-background (S/B) ratios in EELS. [2,3]
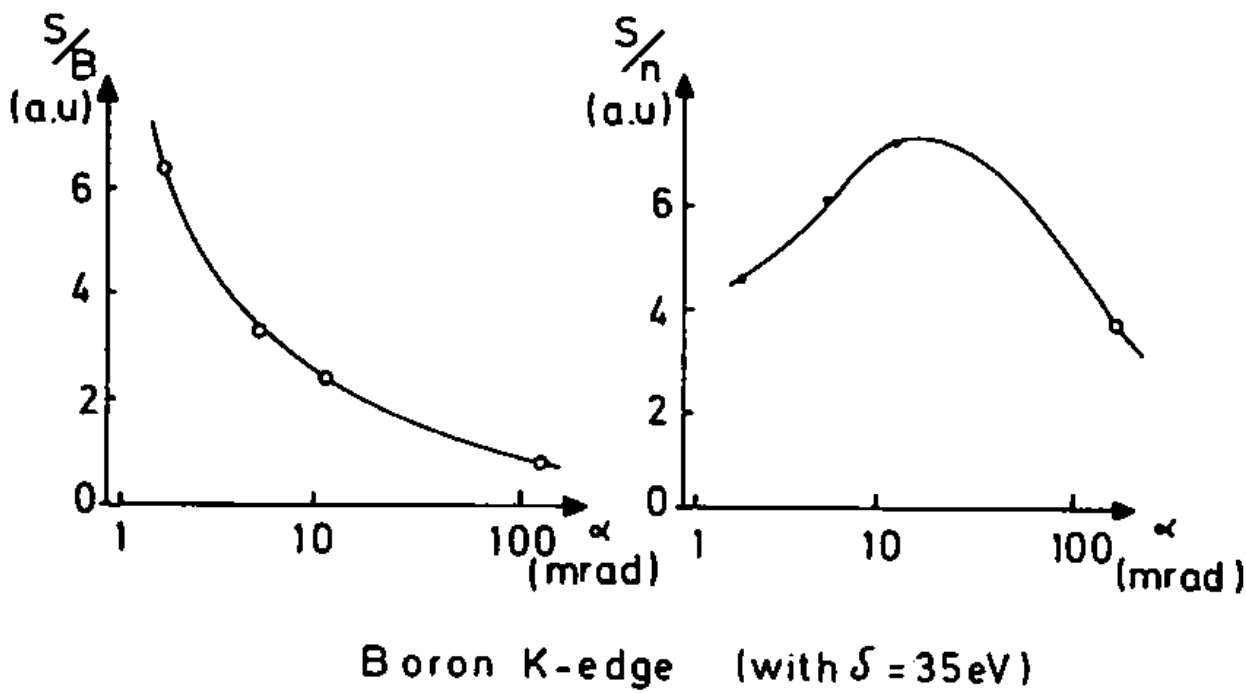
The decrease of the signal/background with larger collection semi-angles is shown in Figure 3413c. However, restricting the aperture means that a detectable signal becomes smaller, so that a compromise must be applied. It is then suggested that an optimum collection semi-angle is the order of 10 mrad.
[1] C. C.Ahn, Transmission Electron Energy Loss Spectrometry in Materials Science and the EELS Atlas, 2004.
|
|
||||||||||||||||||||||||||||