|
|
Unique Measurements by Holography
- Practical Electron Microscopy and Database -
- An Online Book -
|
|
https://www.globalsino.com/EM/
|
|
This book (Practical Electron Microscopy and Database) is a reference for TEM and SEM students, operators, engineers, technicians, managers, and researchers.
|
=================================================================================
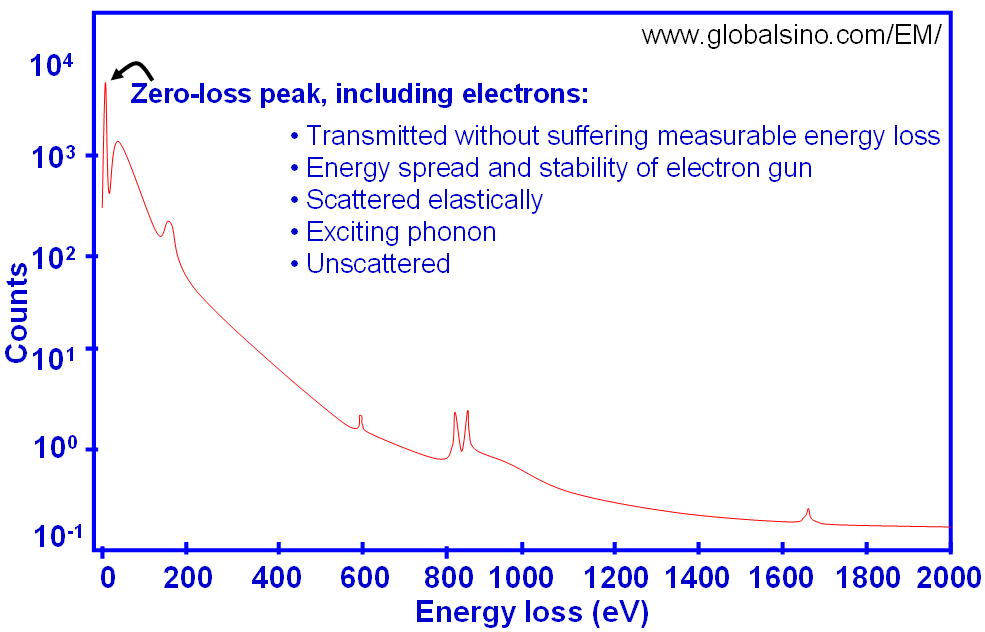
The first peak in EELS spectrum occurs at 0 eV, called zero-loss or “elastic” peak as shown in Figure 3938. This is the most intense peak, especially for a very thin specimen. It represents electrons that undergo inelastic scattering without suffering measurable energy loss (e.g. electrons scattered elastically and those that excite phonons) but which might have been scattered elastically through interaction with atomic nuclei. The zero-loss peak also includes electrons that are unscattered. That means the recorded electrons in the zero loss peak have passed the sample without measurable energy loss or with energy changes too small to be measurable from phonon excitations (a few 10 meV). The width of the zero-loss peak, typically 0.2 – 2 eV, reflects mainly the energy distribution of the electron source. However, it is important to note that the corresponding electron waves undergo a phase change, which is only detectable by holography or high-resolution imaging.

Figure 3938. Zero-loss or “elastic” peak in EELS profile on a logarithmic scale.
|
=================================================================================
The book author (Dr. Liao) welcomes your comments, suggestions, and corrections, please click here for submission. You can click How to Cite This Book to cite this book. If you let Dr. Liao know once you have cited this book, the brief information of your publication will appear on the “Times Cited” page. This appearance can help advertise your publication.
|
|
