Reliability/Reproducibility of EDS Data & EDS System - Practical Electron Microscopy and Database - - An Online Book - |
|||||||||||||||||||||||||||||||||||||
| Microanalysis | EM Book https://www.globalsino.com/EM/ | |||||||||||||||||||||||||||||||||||||
| ================================================================================= | |||||||||||||||||||||||||||||||||||||
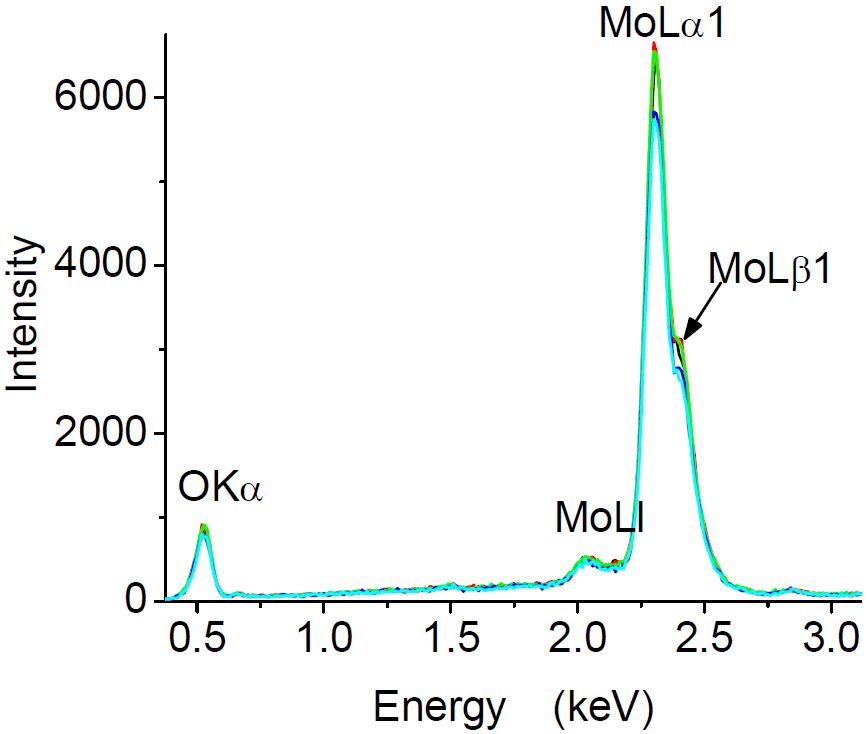
Figure 1228 shows five EDS profiles obtained at the same region of a bulk MoO3 sample. The O and Mo peaks are Gaussian peaks. The measurements were performed at 35.0 µs of time constant, 25kV of accelerating voltage, 100 s of acquisition time, around of 30% of dead time, 100 x of magnification and 11 mm of working distance in a SEM system. Table 1228 lists the chemical composition of MoO3 obtained with O K and Mo L lines. We can know that the composition values of the five profiles are not exactly constant because of the uncertainty of the EDS system at different times.
[1] Carlos Angeles-Chavez, Jose Antonio Toledo-Antonio and Maria Antonia Cortes-Jacome, Chemical Quantification Mo-S W-Si Ti-V by Energy Dispersive X-Ray Spectroscopy, in X-Ray Spectroscopy, edited by Shatendra K Sharma, 2012.
|
|||||||||||||||||||||||||||||||||||||
| ================================================================================= | |||||||||||||||||||||||||||||||||||||
|
|
|||||||||||||||||||||||||||||||||||||