EDS Measurement of Calcium (Ca) - Practical Electron Microscopy and Database - - An Online Book - |
||||||
| Microanalysis | EM Book http://www.globalsino.com/EM/ | ||||||
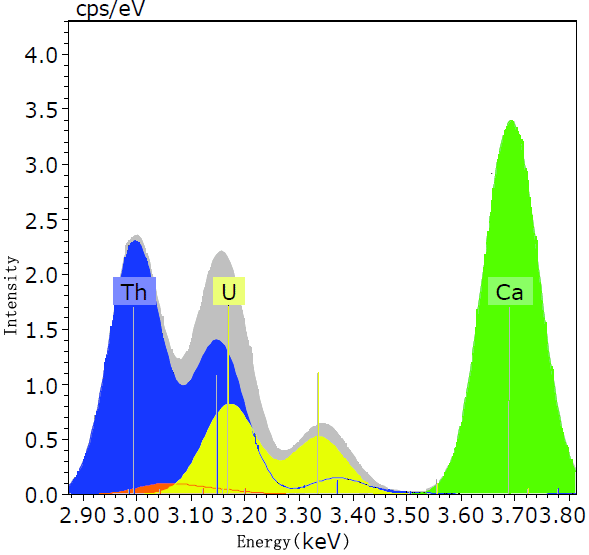
Figure 1397 shows a deconvoluted X-ray spectrum taken from a material containing Th, U, and Ca elements. The different colored peaks represent the contribution of the various elements. The grey area is the background corrected spectrum which is the sum of all the deconvoluted lines.
[1] T. Salge, R. Neumann, C. Andersson, M. Patzschke, Advanced Mineral Classification Using Feature Analysis and Spectrum Imaging with EDS, 23rd International Mining Congress & Exhibition of Turkey, 16-19 April, 357, 2013. |
|
|||||