|
This book (Practical Electron Microscopy and Database) is a reference for TEM and SEM students, operators, engineers, technicians, managers, and researchers.
|
=================================================================================
Figure 1700 shows XRD patterns of Zr70-xNbxCu13.5Ni8.5Al8 (x=0, 2, 4, 6, 7, 8, 10) alloys. The broad peaks in the patterns of the samples with Nb content <8 at.% indicate the samples are in amorphous phase. The patterns of the samples with 8 and 10 at.% Nb present an intense double peak and several weak peaks that is indexed in icosahedral phase (I-phase) [2–4].
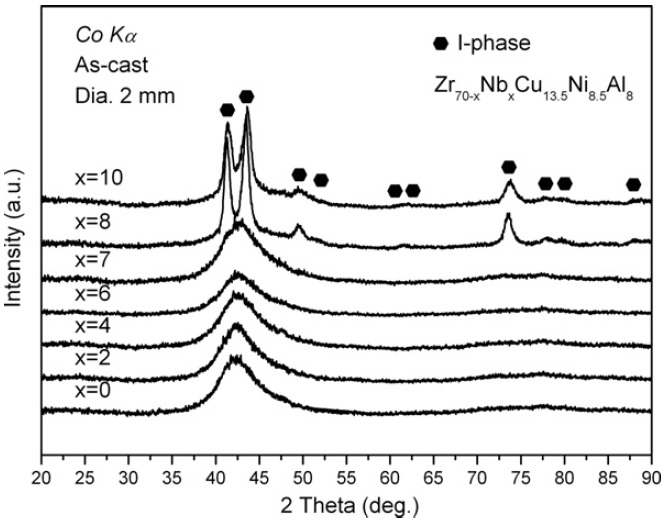
Figure 1700. XRD patterns of the as-cast Zr–Nb–Cu–Ni–Al alloys. [1]
[1] Z.W. Zhu, L. Gu, G.Q. Xie, W. Zhang, A. Inoue, H.F. Zhang, Z.Q. Hu, Relation between icosahedral short-range ordering and plastic deformation in Zr–Nb–Cu–Ni–Al bulk metallic glasses, Acta Materialia 59 (2011) 2814–2822.
[2] Kuhn U, Eckert J, Mattern N, Schultz L. Appl Phys Lett 2000;77:3176.
[3] Fan C, Inoue A. Scripta Mater 2001;45:115.
[4] Miller PD, Murray Gibson J. Ultramicroscopy 1998;74:221.
|