=================================================================================
The configuration of the valence electrons in carbon is a combination (called hybrids) of s and p orbitals. Graphite is one example with an sp2 type, while diamond is of an sp3 form.
For graphite, two 2p and one 2s orbitals hybridize to form sp2 atomic orbitals at a lower energy level, while a single p orbital remains at the original 2p energy level. This 2p orbital forms the π and π* molecular orbitals.
The sp2 bonded solids have both σ/σ* and π/π* states available to the electrons, while for sp3 bonded solids only the σ/ σ* states present. For the diamond and graphite, electron transitions to these states generate many of the characteristic features in EEL spectra. For instance, in core loss spectra from diamond, the excitation of the 1s electrons to the σ* states generates the carbon k edge peak. For graphite, the transitions of the inner shell electrons into unoccupied π* states give a peak prior to the edge onset. In the valence band, valence electron transitions into the π* states also produce a peak at around 6 eV. Figure 2623a shows carbon (C) K edge from materials containing the carbonate anion (calcite, siderite, desautelsite, and hydrotalcite) and three allotropes of C (amorphous , graphite, and diamond). EELS profiles of amorphous C and graphite present basically the same edge shapes, with the first peak at 285 eV induced by transitions to the π* molecular orbital due to the presence of sp2 bonding, and the second, more intense peak at 290 eV induced by transitions to σ* orbitals. In diamond the bonding between the C atoms can be interpreted in terms of tetrahedrally directed sp3 hybrid orbitals, and the first peak with a maximum at 292.6 eV is identified as arising from transitions to molecular orbitals of σ* character.
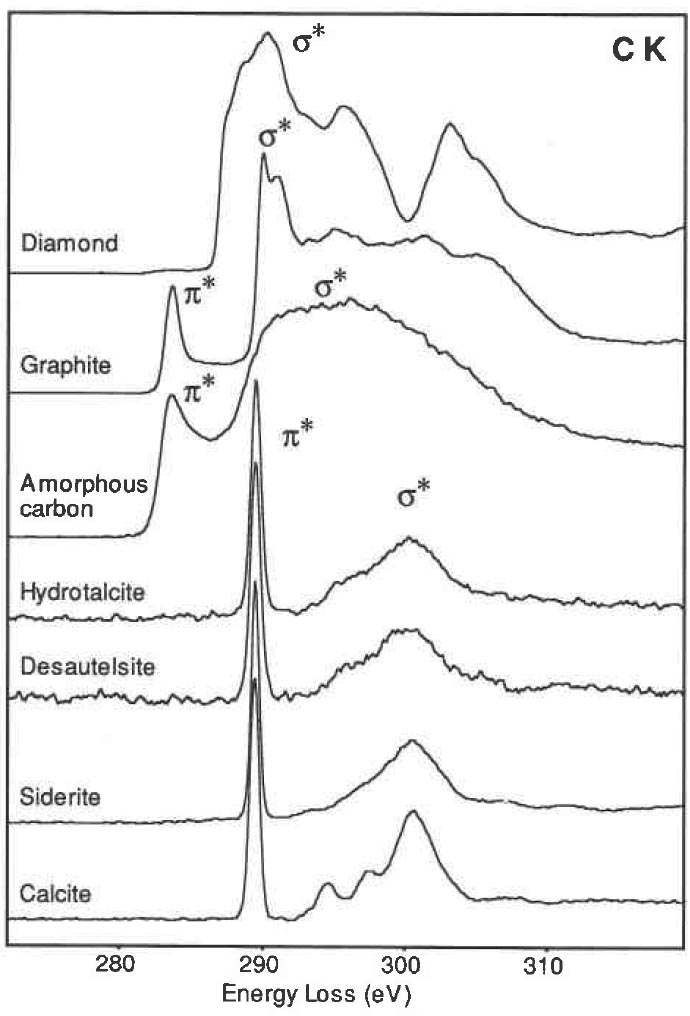
Figure 2623a. Carbon K edge from calcite, siderite, desautelsite, hydrotalcite, amorphous, graphite, and diamond.
For carbon nanotubes and graphite, as shown in Figure 2623b, not only does the core electron EELS spectra for the nanotubes shift to lower energies from those of graphite due to their lower-dimensional feature and thus due to the lower carrier densities and conductivities than graphite, but also the EELS on both the tubule bundle and graphite are sensitive to the incident electron beam along their crystalline axis.
Figure 2623b. Core electron EELS spectra for both nanotubes and graphite with the incident electron in TEM along their different crystal orientations.
Adapted from [1]
Table 2623a. Slip systems in graphite.
|
Type of slip |
| (0001) in [2-1-10] |
Basal |
| (0001) in [2-110] |
Basal |
| (01-10) in [2-1-10] |
Prism |
| (2-1-10) in [0001] |
Prism |
| (-12-10) in [0001] |
Prism |
Table 2623b. Other characteristics of graphite.
[1] V.P. Dravid, X. Lin, Y. Wang, X. K. Wang, A. Yee, J. B. Ketterson, and R. P. H.
Chang. Science, 259, 1601 (1993).
|