=================================================================================
In general, EELS can provide elemental data on light elements in materials. However, in most cases, it is not possible to detect He and H elements with EELS technique. It is difficult to detect hydrogen with EELS because:
i) When hydrogen atoms are in compounds, hydrogen donates its electron to the host in the matrix and thus becomes a loosely
bound proton. Therefore, hydrogen typically does not generate an EELS signal of its own.
ii) The elastic scattering cross-section of hydrogen is much smaller than for other elements.
The major edge of H element is K edge (13 eV), which is in the range of plasmon energy of other elements. The cross-sections are of the order of 1 pm2 per atom. There are still some cases, in which the H can be directly or indirectly detected by EELS technique, for instance:
i) Molecular H2 can be detectable with EELS.
ii) Hydrogen can be detected by measuring the plasmon energy shift if the plasmon energy of the matrix is known.
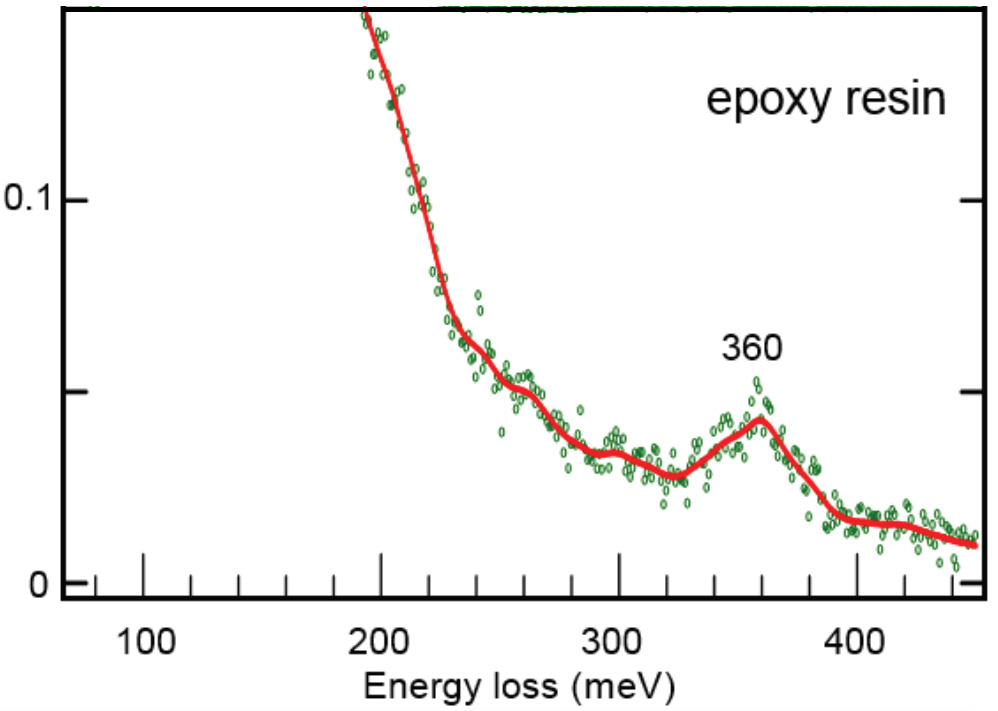
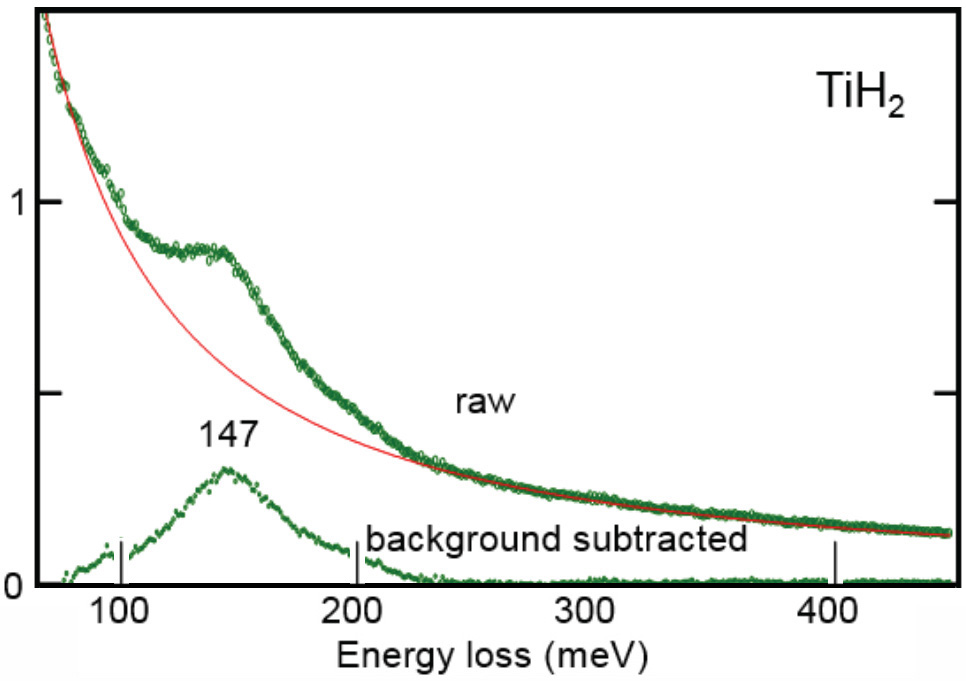
iii) EELS can detect the molecules containing H element with ultra-high energy resolution (UHR) EELS. For example, electron monochromator [2] has improved the EELS energy resolution about 3-fold, to ~10 meV. At such high energy resolution, vibrational spectroscopy is available in the electron microscope. [3] With the single proton nucleus of hydrogen, the highest energy vibrational peaks can be produced, and thus be easily detected. Table 3403a and Figure 3403a show the characteristics of the vibrational spectra of titanium hydride (TiH2) and epoxy resin.
Table 3403a. Vibrational peaks of TiH2 and
epoxy resin.
| Materials |
Vibrational peak |
Origin of peak energy |
| TiH2 |
147 meV |
Loosely bound hydrogen |
| Epoxy resin |
360 meV |
More
strongly bound hydrogen |
| Figure 3403a. UHR EEL spectra of TiH2 and
epoxy resin. Adapted from [4] |
Brown and Ho [1] used an EELS spectrometer with an incident electron energy of 10 eV, consisting of a double-pass cylindrical monochromator and single-pass cylindrical analyzer, to analyze the interaction between methyl chloride and Si( 100) 2 x 1. Figure 3403b shows the EEL spectra obtained from methyl chloride (CH3CI) onto the Si(100) surface held at 85 and 300 K. The origin of the peaks, related to the existence of molecularly adsorbed species, is listed in Table 3403b.
| Figure 3403b. The EEL spectra obtained after 1 L exposures of methyl chloride onto the Si(100) surface held at 85 and 300 K. [1] |
Table 3403b. The origin of the peaks in Figure 3403.
| Energy loss |
Origin |
| 67 meV |
The Si-Cl stretch: an adsorbed chlorine atom |
| 89
meV |
The C-Cl stretch of a
weakly bound methyl chloride molecule |
| 85 meV |
The Si-(CH3) stretch |
| 157 meV |
The CH3 symmetric deformation mode |
| 178 meV |
The CH3 asymmetric deformation mode |
| 368 meV |
The C-H stretch
modes |
[1] Kyle A. Brown and W. Ho, The interaction of methyl chloride and Si( 100) 2 x 1, Surface Science 338 (1995) 111-116.
[2]
O. L. Krivanek et al., Microscopy 62 (2013) 3-21.
[3] O. L. Krivanek et al., Nature 514 (2014) 209-212.
[4] H. Cohen, P. Rez, T. Aoki, P.A. Crozier, N. Dellby, Z. Dellby, D. Gur, T.C. Lovejoy,
K. March, M.C. Sarahan, S.G. Wolf and O. L. Krivanek, Hydrogen Analysis by Ultra-High Energy Resolution EELS, Microsc. Microanal. 21, 661, 2015.
|