=================================================================================
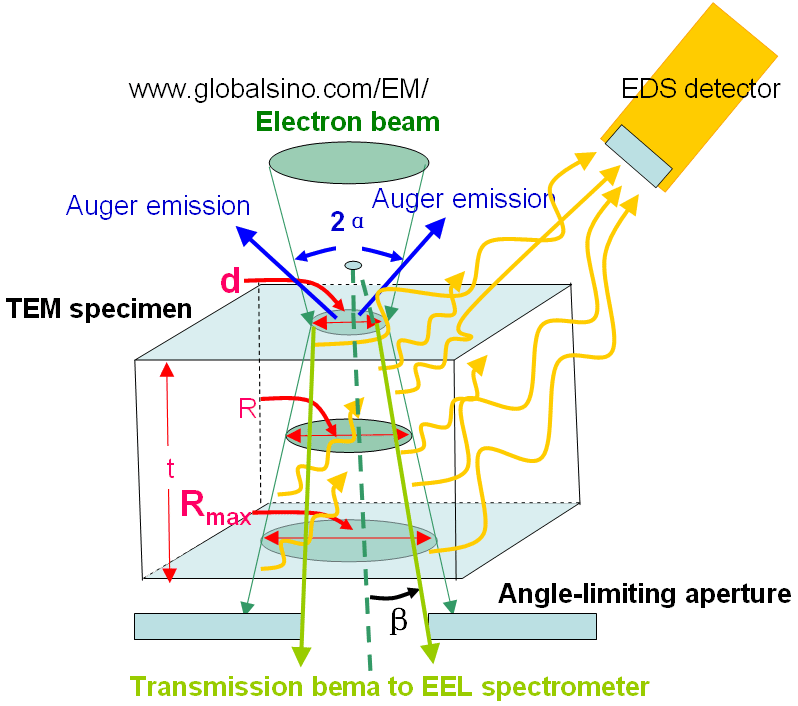
Figure 3985a shows the schematic illustration of the broadening of electron beam within a thin specimen and of generations of EDS, EELS and AES signals. This beam broadening affects the spatial resolution of EDS significantly, but does not affect those of EELS and AES too much. d, R and Rmax are the spot size , the average diameter, and the maximum diameter of the electron beam within the specimen, respecitively. α and β are convergence semiangle of the electron beam and the collection semiangle of EELS/EFTEM. The angle-limiting aperture can be the objective aperture of TEM/STEM system or the entrance aperture of the EELS system, which is smaller and dominates the beam intensity arriving at the camera. That is, the TEM specimen for EELS measurement is very thin and not all of these broadened electrons can enter an EELS spectrometer so that Equation 4626 might overestimate beam broadening for EELS profiling and EFTEM imaging, meaning the beam broadening in TEM specimens do not affect the spatial resolution of EELS profiling and EFTEM imaging too much.

Figure 3985a. Schematic illustration of the broadening of electron beam
within a thin specimen and of generations of EDS, EELS and AES signals.
The spatial resolution for both the EDS and EELS analyses is improved with the accelerating voltages, since the incident electron beam spread decreases with an increase in the accelerating voltage.
The spatial resolution of the inelastic images in TEMs (e.g. EFTEM images and EELS analysis) can be expressed by the following equation,
 ---------- [3985] ---------- [3985]
where,
R -- An inelastic scattering delocalization factor;
ΔEslit -- The energy slit width;
E0 -- Eenergy of incident electron beam.
The second term in Equation 3985 is related to a beam broadening factor due to chromatic aberration (Cc) of the objective lens because of the finite width of the energy-selecting slit. The last term is related to spherical aberration (Cs) of the objective lens.
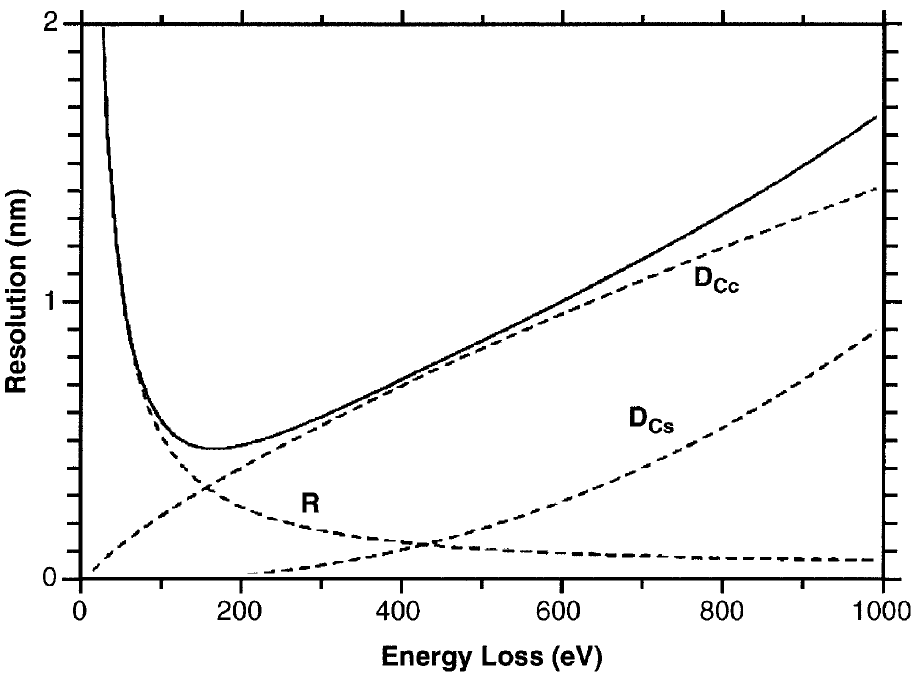
Figure 3985b shows the theoretical plots of the spatial resolution of the energy-filtered images as a function of the loss energy for a 300 kV TEM [1]. In the modeling, the energy slit width used was 20 eV, the characteristic scattering angle was considered to be 0.1 rad (~5.7°), and the spherical and chromatic aberrations are 0.6 and 1.5 mm, respectively. In conclusion, the figure indicates the spatial resolution is dominated by the inelastic delocalization factor (R) at the energy losses lower than ~100 eV, while at an energy losses higher than ~100 eV, the spatial resolution is mainly affected by both the chromatic broadening (Dcc) and the spherical broadening (Dcs).

Figure 3985b. Theoretical plots of the spatial resolution of energy-filtered
images as a function of energy loss. [1]
[1] Yoshio Bando, Masanori Mitome, Dmitri Golberg, Yoshizo Kitami, Keiji Kurashima, Toshihiko Kaneyama, Yoshihiro Okura and Mikio Naruse, New 300 kV Energy-Filtering Field Emission Electron Microscope, Jpn. J. Appl. Phys. Vol. 40 (2001) pp. L1193 – L1196.
|

 ---------- [3985]