|
This book (Practical Electron Microscopy and Database) is a reference for TEM and SEM students, operators, engineers, technicians, managers, and researchers.
|
=================================================================================
At defocus (Δf), the intensity distribution of the diffractogram can be given by,
 ---------------- [4169] ---------------- [4169]
where,
ψ(x) -- The electron wave function in real space
k -- The reciprocal space vector
Note that adjusting defocus and defocus instability, in CTEMs with LaB6 or W eelectron guns and FE-EMs, affects the intensity of diffractogram and real images.
Figures 4169 (a) and (b) shows CTFs and diffractograms obtained based on two different TEM systems. The 1-D diffractograms (intensity spectra) cannot simply be said to be equal to the absolute value of CTF, but in “ideal” condition they are equal. The profiles were obtained by computing for zero beam convergence at Scherzer defocus. The “Ghosts” in the circular 2-D diffractograms were aliasing from sub-sampling of the fine rings. In Figure 4169 (a), the transfer drops to 1/e2 at 1.05 Å, while in Figure 4169 (b) the transfer is still 50% at 1.05 Å and falls to 1/e2 at 0.8 Å, resulting higher spatial resolution.
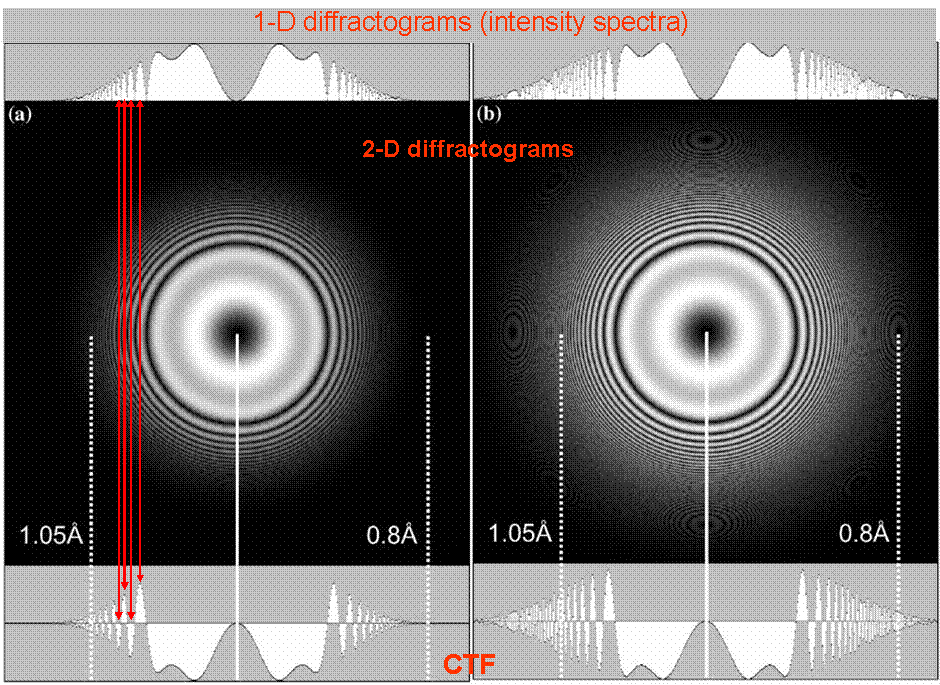
Figure 4169. (a) and (b) CTFs and diffractograms obtained based on two different TEM systems [1].
[1] M. A. O’Keefe, C. J. D. Hetherington, Y. C. Wang, E. C. Nelson, J.H. Turner, C. Kisielowski, J. -O. Malm, R. Mueller, J. Ringnalda, M. Pane, and A. Thust, Sub-Ångstrom high-resolution transmission electron microscopy at 300 keV, Ultramicroscopy 89 (2001) 215–241.
|