Chapter/Index: Introduction | A | B | C | D | E | F | G | H | I | J | K | L | M | N | O | P | Q | R | S | T | U | V | W | X | Y | Z | Appendix
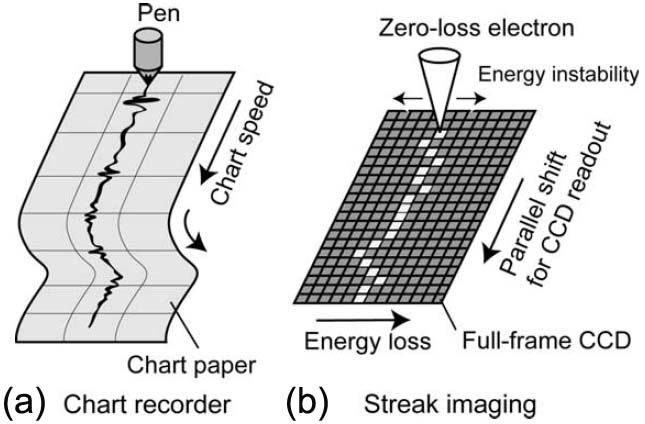
| Basically, EELS (Electron Energy Loss Spectroscopy) is converted to light using a transmission phosphor, then converted to electrons using a photomultiplier for serial acquisitions or using a position-sensitive-detector for parallel acquisition, either a self-scanned photodiode array (PDA) or a charge-coupled device (CCD) [1 - 2]. The latter system has many advantages: 1) produce a full two-dimensional image of the spectrum; 2) capture energy-filtered microdiffraction patterns. In TEM and EELS measurements, energy instabilities normally originate from the fields in the frequency range of 50 or 60 Hz. To detect the 50-Hz instability, the time resolution of the detector needs to be below 10 ms, however, conventional CCDs cannot be used to acquire an EEL spectrum with such a short exposure time. Because the CCD exposure time in EELS measurements cannot be too short, Kimoto et al. [3] employed a so-called streak imaging technique to obtain high-speed spectrum acquisition. The streak imaging technique that was originally applied to visualize energy instability [4] is similar to a chart recorder, as shown in Figure 4894a, where the high-speed spectrum acquisition is achieved by exposing a full-frame CCD during the readout period. Another EEL spectrum is continuously projected on the CCD camera during the parallel shift (i.e. exposure time) of the well electrons. This allows acquiring a series of time-resolved spectra as a two-dimensional image. The time resolution depends on the duration of a well-electron transfer to the adjacent line. Additional benefit is that this spectrum acquisition technique is effective in avoiding artifacts due to the slow beam blanking of an exposure shutter.
For the most common EFTEM unit as shown in Figure 4894b, the detection system consists of a slow scan CCD array detector rather than a single line of diodes used in PEELS detector.
Figure 4894b. Gatan imaging filter using CCD detector.
[1] O. L. Krivanek, C. C. Ahn & R. B. Keeney, Ultramicroscopy 22, 103 (1987).
|