=================================================================================
In high-resolution TEM and STEM analysis, Fourier filtering can be used to:
i) Highlight the features which contribute to a specific spectral power;
ii) Limit the complication caused by an oscillating contrast transfer function (CTF);
iii) Remove some information from the image in order to enhance or highlight the wanted information;
iv) Apply to low-dose images to highlight the feature and remove the noise.
In practice, we filter a Fourier image by selecting the corresponding intensity of a Fourier image. For instance, in HRTEM (high resolution TEM) analysis, Fourier transform is applied to an image, and then we filter the fast Fourier transform (FFT) pattern with a mask, and then we reverse the processing to obtain an understandable TEM image. That is, Fourier filtering is done by masking the Fourier transform spots, using a specific mask size.
Typical low dose STEM imaging can be performed at a dose of ~15-20 e-/Å2 with a probe current of ~1 pA and a scan speed of 1.0 µs per pixel. In this case, the signal to noise ratio (SNR)of recorded images is so low that the naked eyes are not able to recognize any structural information. However, useful high magnification images at an atomic resolution can still be obtained by Fourier-filtering method:
Step i) Convert this image to Fourier-transformed pattern (e.g. with FFT).
Step ii) Use a mask to select the spots.
Step iii) Reversely convert the Fourier-transformed pattern back to real-space image.
Figure 1705 shows the FFT pattern from a HRTEM image. The spots reflect the lattice planes of the original HRTEM image. Note that in the FFT pattern, the long streaks that run normal to the edges of the mask are artifacts of the processing.
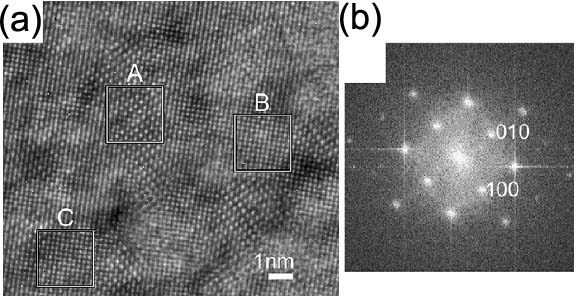
| Figure 1705. (a) HRTEM image of Fe rich matrix viewed along <001>α displaying ordered areas (A) and disordered areas (B or C). (c) Fast Fourier transform of the whole HRTEM image
showing superlattice reflections (100) and (010). Adapted from [1] |
The Fourier-filtered TEM image can be given by,
 -------------- [1705] -------------- [1705]
where,
σ -- An interaction constant,
φ(r) -- The phase shift caused by the specimen,
CTF -- The
contrast transfer function.
[1] P. Galimberti, S. Lay, A. Antoni-Zdziobek, S. Coindeau, b, M. Véron, F. Bley, M. De Boissieu, Precipitation and hardening behaviour of the Fe20Co18W alloy aged at 800 °C, 19 (4) (2011) 556–562.
|