
Chapter/Index: Introduction | A | B | C | D | E | F | G | H | I | J | K | L | M | N | O | P | Q | R | S | T | U | V | W | X | Y | Z | Appendix
| Two main contrast transfer functions (CTFs) are very useful concepts in electron microscopes: The phase contrast transfer function (pCTF) in CTEM is a function which modulates the amplitudes and phases of the electron diffraction pattern formed in the back focal plane of the objective lens and thus shows the phase shifts due to the combination of spherical aberration and defect of focus. Early studies of the aberration effects on pCTF can be found in [3,4]. In conventional high-resolution TEM, the fixed large value of the third-order spherical aberration imposes limits to the contrast transfer of thin objects. The phase shift (phase distortion function) due to the objective lens can be combined into a single phase factor χ, given by, where, Considering the non-constant wavelength of an incident electron beam and the astigmatism, the phase shift function can be described by, The last and the second terms describe the effects of the non-constant wavelength and astigmatism, respectively. When the first-order aberrations (defocus and two-fold astigmatism) are dominant in the CTF, the higher order terms are negligible. Scherzer defocus maximizes the phase contrast of a weak-phase object. The weak phase object approximation (WPOA) implies that only the imaginary part of B(u) contributes to the image contrast; therefore, the (phase) contrast transfer function ((P)CTF) of the objective lens can be given by, T(|g|) = sin χ ---------------------------------------- [4236c] T(|g|) here is not a linear function. For a perfectly coherent illumination, the resulting phase contrast transfer function continues to oscillate between +1 and -1 even at very large spatial frequencies. As indicated in Equation 4236a, the phase shift associated with spherical aberration can be partially offset by having a negative value of the defocus Δf (slight underfocus). For a given degree of underfocus, sin x varies with |g| as shown in Figure 4236a.
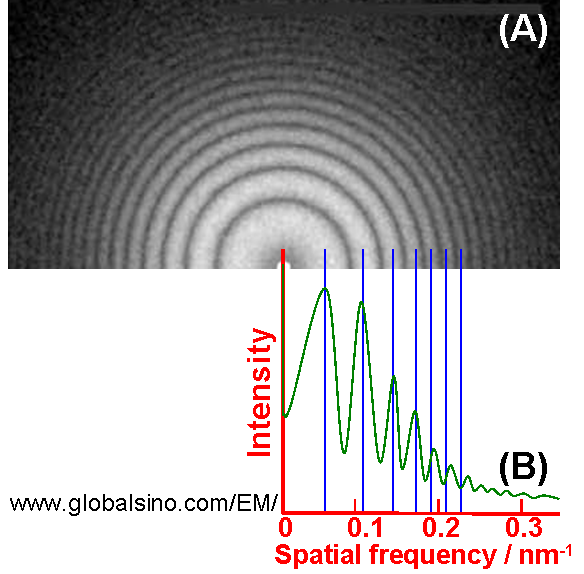
Figure 4236a. Schematic illustration of (P)CTF. More generally speaking, CTF is a combination of the oscillating phase transfer and two envelope functions Et(|g|) and Es(|g|), given by, T(|g|) = Et(|g|)·Es(|g|)·exp[χ(|g|)] ----------------------------- [4236d] where, Thon rings are a phenomenon revealed in the power spectra of micrographs by bright-field (BF) TEM (transmission electron microscopy) imaging. These rings can be explained as the effect of the contrast transfer function, which modulates the Fourier transform of the object in a defocus-dependent way. Figure 4236b (A) shows the power spectrum of a typical BF TEM image of amorphous carbon film presenting concentric Thon rings. Those white rings correspond to the contrast transfer maxima and the dark rings indicate spatial frequency bands without signal. Figure 4236b (B) shows the radial intensity of the power spectra. The astigmatism and defocus can affect the symmetry of the rings, limiting the spatial resolution of the microscope. Therefore, electron micrographs, especially HRTEM, are routinely inspected by optical diffraction before taking images for analysis.
Figure 4236b. (A) Power spectrum of typical bright-filed image of amorphous carbon film presenting
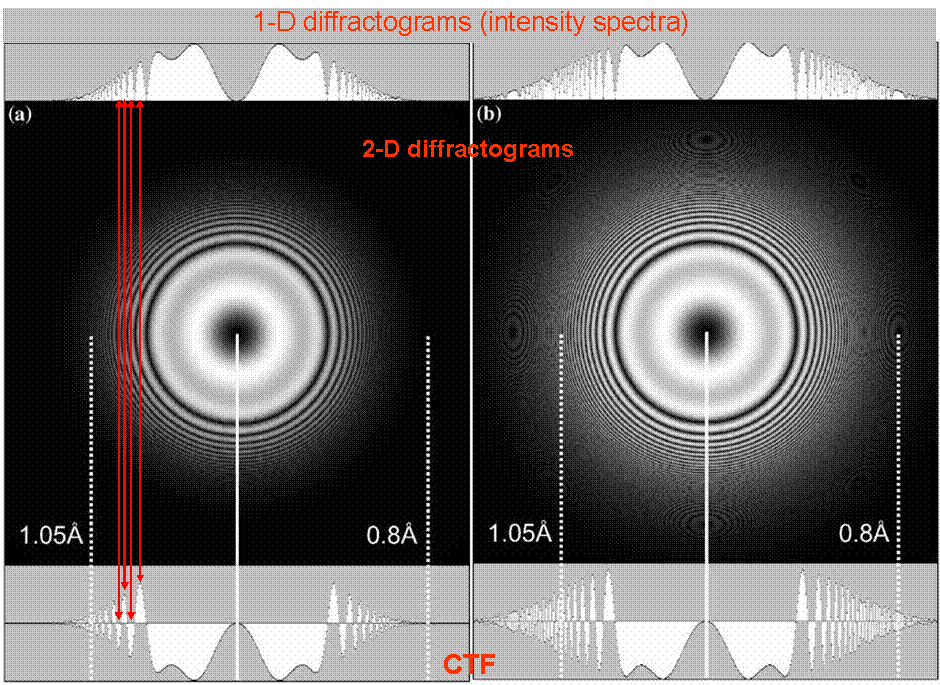
concentric Thon rings taken in TEM. (B) Radial intensity of the power spectra. Figures 4236c (a) and (b) shows CTFs and diffractograms obtained based on two different TEM systems. The 1-D diffractograms (intensity spectra) cannot simply be said to be equal to the absolute value of CTF, but in “ideal” condition they are equal. The profiles were obtained by computing for zero beam convergence at Scherzer defocus. The “Ghosts” in the circular 2-D diffractograms were aliasing from sub-sampling of the fine rings. In Figure 4236c (a), the transfer drops to 1/e2 at 1.05 Å, while in Figure 4236c (b) the transfer is still 50% at 1.05 Å and falls to 1/e2 at 0.8 Å, resulting higher spatial resolution.
Figure 4236c. (a) and (b) CTFs and diffractograms obtained based on two different TEM systems [1]. For a perfect coherent illumination in reciprocal space the CTF can be represented by T(k, g) as [2] where, Overall, the wave function of the image can be given by where,
A(u) -- Aperture function From Equation 4236e, we can know that when the wave of the incident electrons interacts with a TEM sample the scattered parts (the second term on the right of the equation) will be –π/2 out of phase with the direct beam. These scattered beams will then pass through the objective lens at angles which will cause an additional phase change before being combined with the direct beam in the image plane. If the objective lens also gives a –π/2 phase change (namely the phase contrast transfer function is -1) the scattered beams will be –π out of phase and thus interfere destructively with the direct beam. Since the atoms in the sample are the scattering centers, they will appear darker than the background in the image. This is so-called linear imaging conditions in TEM. To avoid having the overall CTF dampened too much by spatial coherence envelopes, temporal coherence envelope function and detector envelope function, it is important to find and use an optimum magnification (the highest useful magnification) since it is impossible in a pixel image to detect spatial frequencies less than the Nyquist limit. In other words, it is impossible to separate two objects in an image if they are closer than one pixel away from each other. In experimental CTF patterns, the background dominates at low frequencies and originates from various factors such as inelastic scattering, camera noise, and object structure. Note that background fitting theoretically is a difficult task and often introduces systematic errors. At high frequencies the oscillations are damped by the envelopes due to the energy spread, finite source size, and the detector’s modulation transfer function (MTF). High-angle incoherently scattered TDS (thermal diffuse scattering) electrons are subject to significant phase shifts from the rapidly varying portion of the lens transfer function and thus will extremely contribute a constant background to the image [5]. Figure 4236d shows the calculated phase contrast transfer functions (pCTF) at Scherzer defoci in 200-keV TEMs with LaB6 and FEG sources and with different spherical aberrations (Cs).
Figure 4236d. Typical pCTFs for 200-keV TEMs: (a) At Scherzer defocus in LaB6 TEM with large positive Cs (1.23 mm), (b) At Scherzer defocus in FEG TEM with large positive Cs (1.23 mm), (c) At Scherzer defocus in FEG TEM with small positive Cs (0.083 mm), and (d) At Scherzer defocus = Lichte defocus in FEG TEM with small negative Cs. Adapted from [6] If the spherical aberration (Cs) is zero in a Cs-corrected microscope, positive phase contrast of a weak-phase object can still be obtained by the defocus, This condition presents a pass band up to the information limit (gmax) at the contrast delocalization of R0 = 1/gmax. Based on Cs correction, extending Scherzer’s point resolution to information limit of the microscope can also optimize the positive phase contrast from a weak-phase object. Assuming gSch = gmax and a defocus of ZSch = -8/(3λg2max) , one can obtain, [7] The resulting contrast delocalization is given by, In this case, the atoms are observed in dark contrast with respect to the background.
Unlike the effects of defocus and spherical aberration, the effect of coma generally cannot be represented in terms of contrast transfer function.
[1] M. A. O’Keefe, C. J. D. Hetherington, Y. C. Wang, E. C. Nelson, J.H. Turner, C. Kisielowski, J. -O. Malm, R. Mueller, J. Ringnalda, M. Pane, and A. Thust, Sub-Ångstrom high-resolution transmission electron microscopy at 300 keV, Ultramicroscopy 89 (2001) 215–241.
|
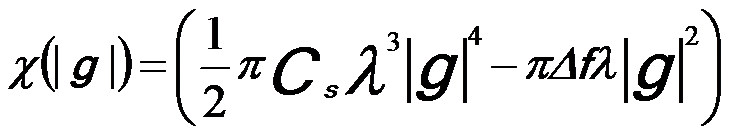 -------------- [4236a.a]
 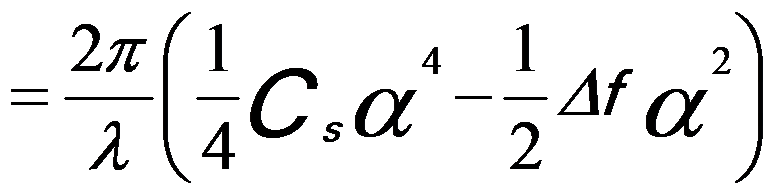 -------------- [4236a.b]
 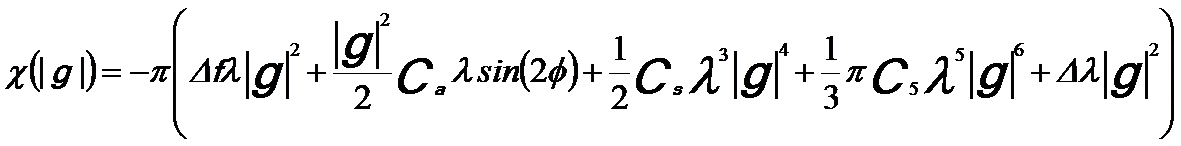 --- [4236b]
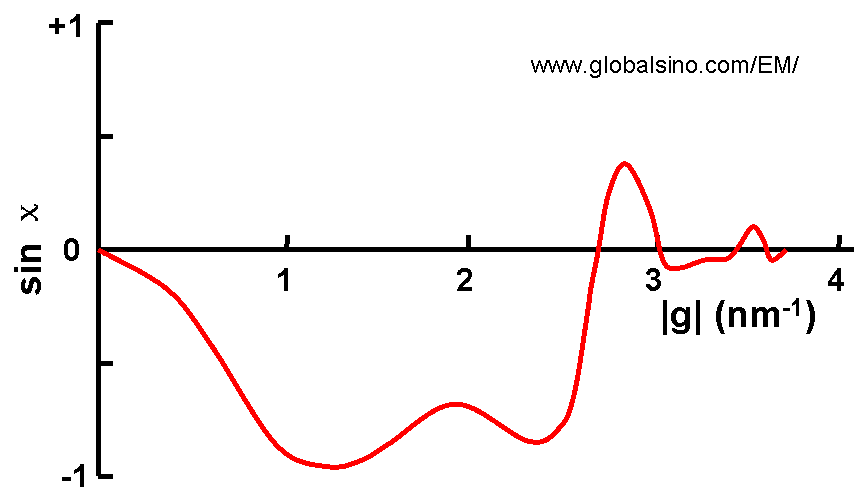
 ---------------------------- [4236e]
  ---------------------------- [4236f]
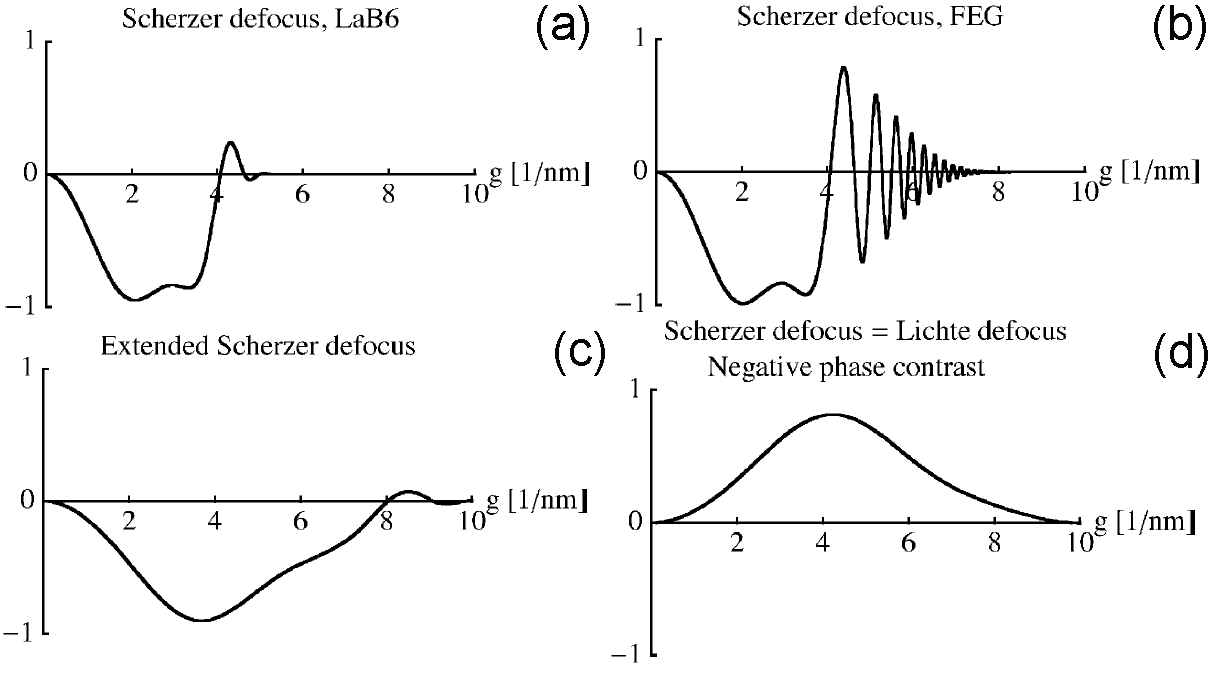
 ----------------------------------- [4236g]