Chapter/Index: Introduction | A | B | C | D | E | F | G | H | I | J | K | L | M | N | O | P | Q | R | S | T | U | V | W | X | Y | Z | Appendix
| Before creation and applications of aberration corrections, a method to improve the capability of electron microscopes (EMs) is to increase the accelerating voltage of the electron gun to ultrahigh voltages in order to penetrate more deeply into thicker samples as listed in Table 4174. Table 4174. Ultrahigh voltage TEMs without aberration corrections.
Information limit for HRTEMs is the inverse of the maximum spatial object frequency. In other words, the information limit is defined as the highest spatial frequency transferred to the image with statistical significance. The information limit is often obtained from measurements of diffractogram or from Young’s fringes provided a weak phase object scattering beyond the inverse of the information limit. HRTEM uses both the direct electron beam (wave) and several diffracted electron beams (waves) to form the image. In this way, the resolution is improved with the multiple beams comparing to bright field imaging because higher spatial frequencies are included. In images formed by elastic scattering (e.g. HRTEM images), contrast delocalization is referred to as the loss of image contrast due to lens aberrations or called blurring effect. In this case, the image information is blurred and displaced from their true locations in the TEM specimen. In other words, the contrast delocalization can also be expressed as the lateral displacement of spatial frequencies in the image. This displacement increases with spatial frequency significantly. It is rarely a problem on the microscopes with LaB6 guns due to their limited coherence in illumination. However, it is a significant imaging artifact in HRTEM images taken from microscopes with field emission guns (FEGs) due to their high coherence that causes a strong contribution of the high spatial frequencies. Thon rings are a phenomenon revealed in the power spectra of micrographs by bright-field (BF) TEM (transmission electron microscopy) imaging. These rings can be explained as the effect of the contrast transfer function, which modulates the Fourier transform of the object in a defocus-dependent way. Figure 4174a (A) shows the power spectrum of a typical BF TEM image of amorphous carbon film presenting concentric Thon rings. Those white rings correspond to the contrast transfer maxima and the dark rings indicate spatial frequency bands without signal. Figure 4174a (B) shows the radial intensity of the power spectra. The astigmatism and defocus can affect the symmetry of the rings, limiting the spatial resolution of the microscope. Therefore, electron micrographs, especially HRTEM, are routinely inspected by optical diffraction before taking images for analysis.
Figure 4174a. (A) Power spectrum of typical bright-filed image of amorphous carbon film presenting
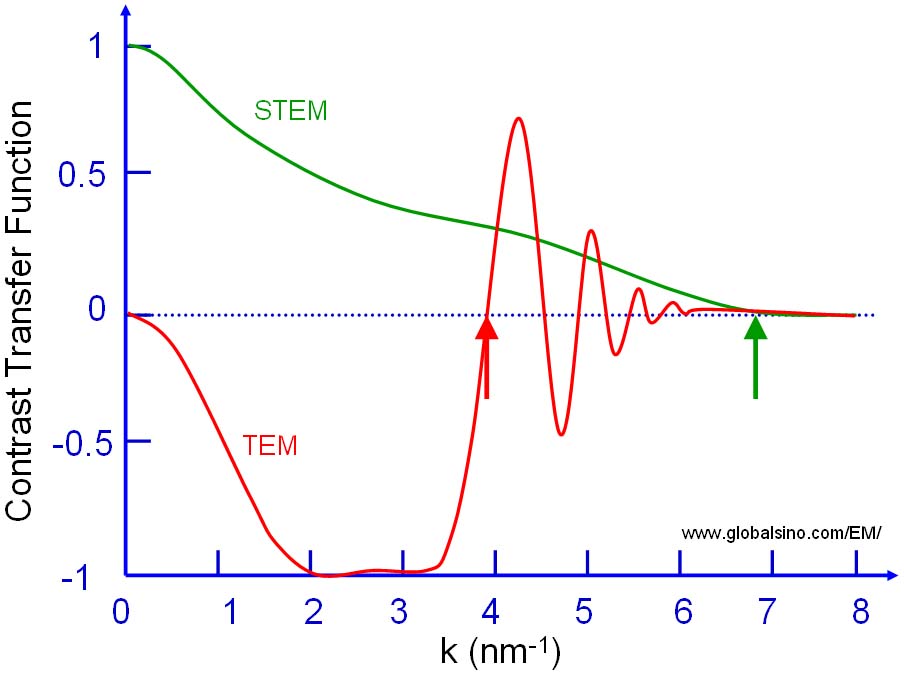
concentric Thon rings taken in TEM. (B) Radial intensity of the power spectra. Figure 4174b shows the schematic comparison between contrast transfer functions (CTFs) for a parallel-beam CTEM and a STEM. The probe forming aperture in STEM is often compared to the objective aperture in the parallel beam illumination in CTEM. The size selection of a post-specimen objective aperture in CTEM is usually made to improve the imaging contrast through exclusion of scattered electrons. Bright-field high resolution imaging in CTEM are normally achieved as long as the aperture is not too small for the collection of electrons scattered to the Bragg spots corresponding to the expected lattice spacings. That is, the higher frequencies should be excluded by a proper objective aperture marked by the red arrow because they introduce contrast reversals. The objective aperture in CTEM essentially is a linear filter determining the frequencies to be included in the image, for example in a weak phase object filtering out the high frequency oscillations in the CTF. The lower frequencies are not affected by increasing the aperture size. For STEM imaging, a proper probe-forming aperture should be applied to match the need of the spatial frequency marked by the green arrow.
Figure 2754b. Schematic illustration of contrast transfer function (CTF) for: (a) A parallel-beam CTEM and (b) A STEM.
[1] R.M. Fisher, T. Imura, Ultramicroscopy 3 (1978) 3.
|