EDS ZAF Quantification Mode & Matrix Correction - Practical Electron Microscopy and Database - - An Online Book - |
||||||||
| Microanalysis | EM Book http://www.globalsino.com/EM/ | ||||||||
| ================================================================================= | ||||||||
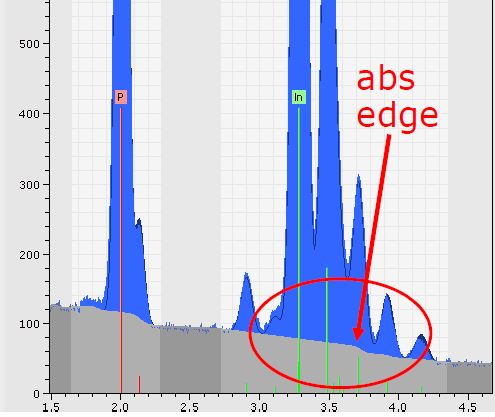
For a bulk specimen, the measured X-ray intensities are modified by the composition of the specimen matrix so that three additional effects need to be taken into account and to be corrected (called ZAF correction): Therefore, the quantification of EDS can be given by, In practical SEM-EDS quantification, matrix correction on EDS software takes into account the atomic number effects, absorption effects and secondary fluorescence effects. The local peak to background (P/B) ratios are then input into the modified ZAF matrix correction. In this case, the P/B-ZAF analysis is normally self-calibrating. When the X-ray absorption is significant, especially for SEM-EDS measurements on bulk samples, the shape of the depth distribution of X-ray production is crucial, and thus ZAF and Phi–Rho–Z models should be used. However, the mass absorption coefficients are still problematic because significant uncertainties exist even in absorption-corrected ZAF and Phi–Rho–Z models. Each ZAF method has many variants with different equations to calculate the corrections. The ZAF correction is iteratively applied until proper Z, A, and F correction factors that are consistent with the composition are found. This method can obtain an accuracy of 1 - 2% for WDS and of 5-7% for EDS, but will be worse if weak signals (low-intensity peaks) are used. In modern EDS quantifications, these effects are now routinely combined for given specimen thickness and density. It is important that both the unknown and reference specimens are measured in the same geometrical conditions of X-ray systems (e.g. distance, angle relative to detector) and all specimen structures and elements are similar. Figure 1746 shows the physical fit of background of an EDX spectrum, taken from an alloy with P 49.29 at.% and In 50.71 at.%, in Bruker software. In this software, P/B-ZAF is optimized for this fit method.
[1] Quantification of EDS spectra, Bruker.
|
||||||||
| ================================================================================= | ||||||||
|
|
||||||||
 ------------------------- [1746]