=================================================================================
For a field emission source, the beam of electrons emitted presents an energy profile described by the Fowler-Nordheim (F-N) distribution [1],
 ------------- [2620a] ------------- [2620a]
Δ = µ - E ---------------------- [2620b]
b = 6.8 x 10⁷α
---------------------- [2620c]
where,
µ -- The chemical potential (Typical value ~ 11 eV);
T -- The cathode temperature;
k -- The Boltzmann constant;
φ -- The work function (for a tungsten tip as 4.5 eV);
α -- The image correction term (Typical value ~ 0.85);
F -- The electric field strength (Typical value ~ 3 x 10⁷ V/m), which is related to
both the extraction voltage and the shape of the W tip;
E -- The accelerating voltage on the incident electrons.
Figure 2620 shows the ZLPs (zero-loss peaks) of a CFEG (cold field emission gun) [3] at various emission currents as well as the monochromatized ZLP [4] in logarithmic vertical scale. The inset lists the extraction voltages V1, probe currents Ip and the FWHMs (full width at half maximum) of the ZLPs. Note that the FWHMs quantify the energy spread. In general, the lower extraction voltage and probe current gives smaller FWHMs of the ZLPs, meaning that the higher energy resolution can be obtained, while the one with a monochromator still has the lowest FWHM.
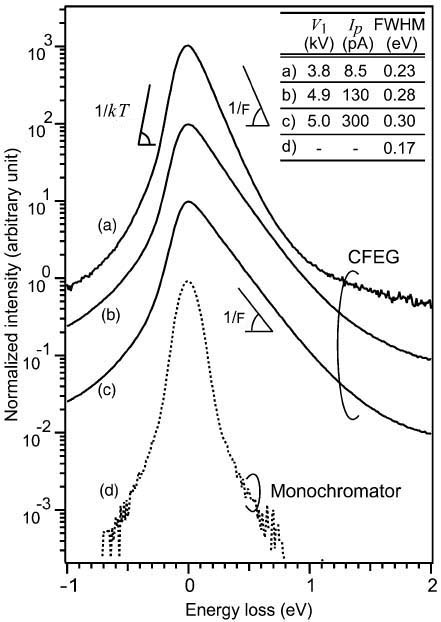
Figure 2620. ZLPs of CFEG under various emission conditions as well as the monochromatized ZLP.
Adapted from [3]
The F-N energy distribution of emitted electrons includes two distinct regions [2]: a low energy Fermi tail and a high energy tunnelling tail. In other words, Equation 2620a indicates that the energy distribution of emitted electrons is the product of the Fermi–Dirac distribution function ln(1+eΔ/kT) and the tunneling probability exp[-b(φ+Δ)3/2/F],
which produce the Fermi tail and the tunneling tail,
respectively, and causes beam energy-broadening in field emission guns. The low energy Fermi tail is a property of the Fermi surface of the tip material (e.g. tungesten) and is independent of the extraction voltage. The left side of the CFEG’s ZLP is comparable to that of the monochromator. The slope of the high energy tunnelling tail is determined by the field strength. In this case, it is difficult to determine the onset of the inelastic scattering within a low-loss spectrum because the tunneling tail induces a strong background. Therefore, the monochromator has an advantage in the measurement of small bandgaps (e.g. ≤1 eV).
[1] Fowler, R.H., Nordheim, L. Electron emission in intense electric fields. Proc. R. Soc. A 119, 173-181 (1928).
[2] Kimoto, K. et al. 0.23eV energy resolution obtained using a cold field-emission gun and a streak imaging technique. Micron 36, 465-469 (2005).
[3] Koji Kimoto, Kazuo Ishizuka, Toru Asaka, Takuro Nagai, Yoshio Matsui, 0.23 eV energy resolution obtained using a cold field-emission gun and a streak imaging technique, Micron 36 (2005) 465–469.
[4] Kothleitner, G., Hofer, F., 2003. EELS performance measurements on a new
high energy resolution imaging filter. Micron 34, 211–218.
|