=================================================================================
The Richardson-Lucy (R-L) method to reconstruct the original image is based on the Bayes’ probability theorem,
 -------------------------------- [2621a] -------------------------------- [2621a]
where,
i -- The image,
o -- The
object,
p(i|o) -- The likelihood probability,
p(o|i) -- The posteriori probability (The conditional probability which is representative of probability o given probability i),
p(o) -- The
prior model on the object.
This theorem presents that the conditional probabilities of the event o and resulting event i can be expressed in a similar manner. Therefore, the R-L deconvolution algorithm can be derived using probability theory.
Figure 2621a shows the schematic illustration of the simplest probability expression. If two probability events o and i occur in a single process, and thus those events are independent of each other. Therefore, the joint probability of the two events can be given by,
 -------------------------------- [2621b] -------------------------------- [2621b]
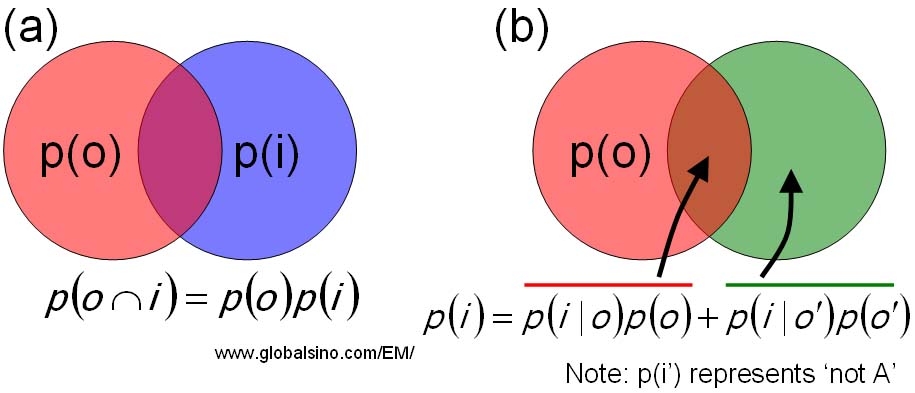
Figure 2621a. Schematic illustration of the probability laws. (a) The probability of events o and i occurring. (b) The total law of probability for a two event system.
If the probability of one event depends on the result of the other event, then the probability of the two events will be given by,
 -------------------------------- [2621c] -------------------------------- [2621c]
As shown in Figure 2621a, the law of the total probability for the two event system (the probability of event i is conditional on event o), is given by,
 -------------------------------- [2621d] -------------------------------- [2621d]
Substituting Equation 2621d into
Equation 2621a, we can have,
 ----------------- [2621e] ----------------- [2621e]
For EELS analysis, the final energy resolution of the system is limited by the energy spreads of the beam at the electron source and due to the spectrometer optics. The resulting “degraded” spectrum is given by,
 ------------------------------- [2621f] ------------------------------- [2621f]
where,
H -- The acquired spectrum,
W -- The true (non-degraded) spectrum,
S -- The Point Spread Function (PSF) of the system.
The R-L algorithm can be applied to deconvolute the “degraded‟ EEL spectrum in order to obtain a spectrum with an improved energy resolution. In this case,
Bayes' theorem becomes,
 ------------------------------- [2621g] ------------------------------- [2621g]
where,
Wm -- The mth location in the W array or the value associated with the mth location,
Hn -- The nth location in the H array or the value associated with the nth location,
j -- A location on the W array.
Equation 2621g can be practically reduced to apply to a 1-D (one dimensional) energy dispersive spectrum,
 ------------------------------- [2621h] ------------------------------- [2621h]
where,
j -- A location on the S array,
r -- The number of iterations.
Based on Equation 2621h, for instance, script can be applied to Digital Micrograph for EELS deconvolution with inputting a measured PSF obtained under the same operating conditions as the spectrum.
Note that noise reduction by other algorithms is required prior to the application of R-L deconvolution if the raw signals (e.g. images and EEL spectra) have very poor signal to noise ratio.
In order to improve the energy resolution of EEL spectrum, before spectrum deconvolution, scripts (e.g. applied in Gatan Digital Micrograph) can be used to automatically acquire and store each spectrum separately, and then to evaluate and correct the energy drift in each acquisition. [1, 2] After the drift correction, the EEL spectrum can be deconvoluted using software. For instance, some deconvolution techniques are Fourier ratio method, maximum-entropy (ME) [3,4] and Richardson–Lucy (RL) algorithms [5]. In the Fourier ratio method, the "ideal" core-loss spectrum is obtained by inverse Fourier transform. Since the Fourier ratio deconvolution is a high-frequency enhancement technique, high-frequency noise in the core-loss spectrum is substantially amplified. The ME and RL algorithms estimate a predicted spectrum by convoluting it with an observed low-loss spectrum, and thus they are not so significantly affected by high-frequency noise as compared with the Fourier ratio deconvolution technique.
Examples in Figure 2621b shows the effects of energy resolution enhanced by energy-drift correction and deconvolutions in the EEL spectrum of h-BN. The EEL spectra are acquired with an exposure time of 80 ms, a probe current of 100 pA and a high energy-dispersion (0.021 eV ch–1). Figure 2621b (a) shows a blind-sum spectrum with a wide energy spread of 0.48 eV in FWHM (full width at half maximum) due to the energy drift during data acquisition. Figures 2621b (b) shows the improvement by the energy-drift correction, reflecting the inherent high energy-resolution of a cold field emission electron gun (CFEEG). Figures 2621b (c) and (d) show the boron K-edge spectra before and after drift correction, respectively, with π* peak reduced from 1 to 0.52 eV. Figures 2621b (e) and (f) shows further improvement by RL (Richardson-Lucy) and ME (maximum-entropy) deconvolution, respectively.
Figure 2621b. Low-loss and core-loss spectra of h-BN. (a) and (c) raw spectrum, (b) and (d) spectra after drift correction, and (e) and (f) deconvoluted B K-edge ELNES using RL algorithm and ME algorithm, respectively.
Adapted from [6]
[1] Kimoto K and Matsui Y (2002) Software techniques for EELS to realize
about 0.3 eV energy resolution using 300 kV FEG-TEM. J. Microsc.
208: 224–228.
[2] Koji Kimoto, Kazuo Ishizuka, Teruyasu Mizoguchi, Isao Tanaka and Yoshio Matsui, The study of Al-L23 ELNES with resolution-enhancement software and first-principles calculation, Journal of Electron Microscopy 52(3): 299–303 (2003).
[3] Kuzuo R and Tanaka M (1993) Resolution enhancement of electron
energy-loss spectra using the maximum entropy method. J. Electron
Microsc. 42: 240–243.
[4] Overwijk M H F and Reefman D (2000) Maximum-entropy deconvolution
applied to electron energy-loss spectroscopy. Micron 31: 325–331.
[5] Gloter A, Douiri A, Tencé M, Imhoff D, and Colliex C (2002) Improving
energy resolution of EELS spectra: an alternative to the monochromator
solution. In: Proc. of 15th ICEM, Durban, South Africa, pp. 141–142.
[6] Koji Kimoto, Kazuo Ishizuka, Teruyasu Mizoguchi, Isao Tanaka and Yoshio Matsui, The study of Al-L23 ELNES with resolution-enhancement software and first-principles calculation, Journal of Electron Microscopy 52(3): 299–303 (2003).
|